Technical Analysis of VRNS 2024-05-10
Overview:
In analyzing the technical indicators for VRNS over the last 5 days, we will delve into the trend, momentum, volatility, and volume indicators to provide a comprehensive outlook on the possible stock price movement. By examining these key factors, we aim to offer valuable insights and predictions for the upcoming days.
Trend Analysis:
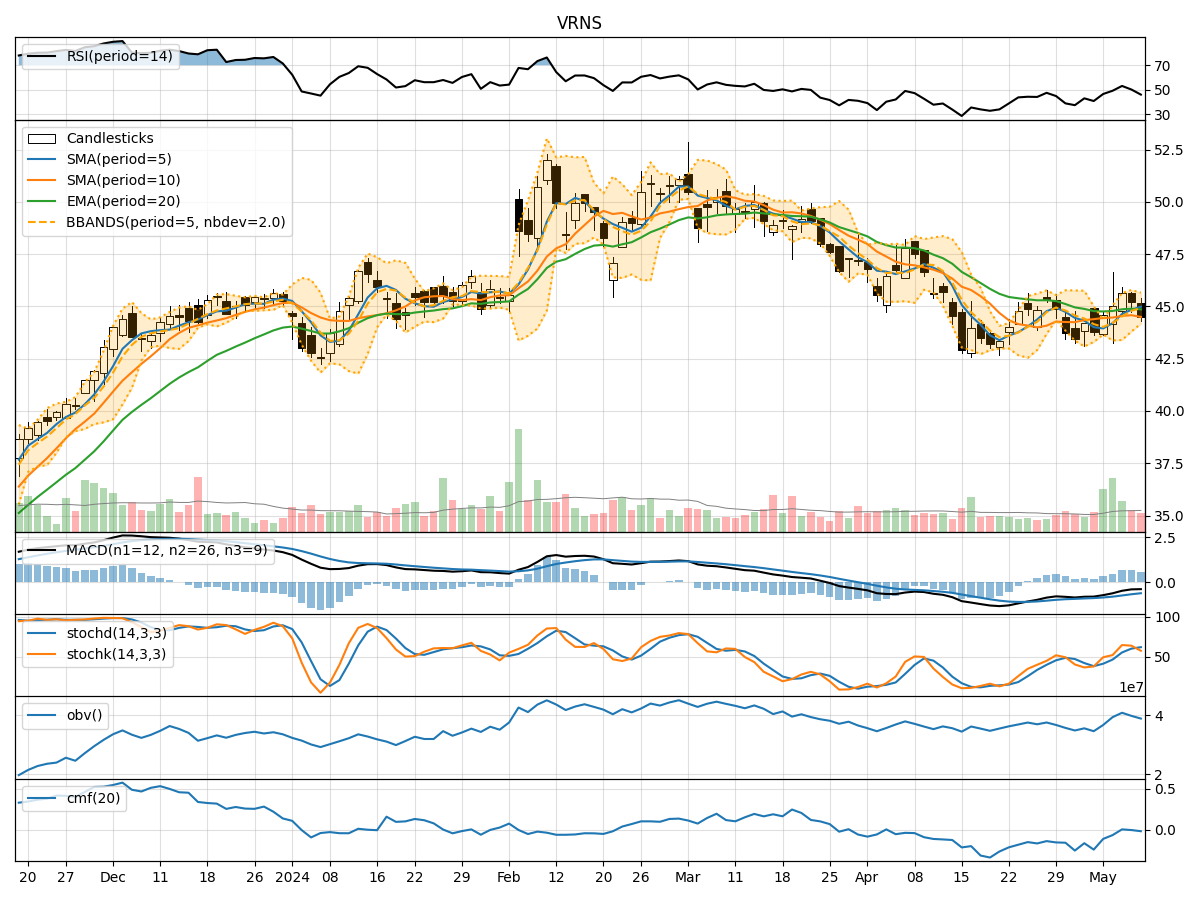
- Moving Averages (MA): The 5-day MA has been fluctuating around the closing prices, indicating short-term price trends. The SMA(10) and EMA(20) have shown a slight upward trend, suggesting potential bullish momentum.
- MACD: The MACD line has been consistently below the signal line, indicating a bearish trend. However, the MACD histogram has shown signs of convergence, hinting at a possible trend reversal.
Momentum Analysis:
- RSI: The RSI has been fluctuating around the 50 level, indicating a neutral momentum in the stock. There is no clear overbought or oversold signal.
- Stochastic Oscillator: Both %K and %D lines have been in the overbought zone, suggesting a potential reversal or consolidation in the stock price.
- Williams %R: The Williams %R has been in the oversold territory, indicating a bearish sentiment in the market.
Volatility Analysis:
- Bollinger Bands (BB): The stock price has been trading within the Bollinger Bands, with the bands narrowing, indicating decreasing volatility. A breakout may be imminent.
- Bollinger %B: The %B indicator has been hovering around the middle range, suggesting a neutral stance in terms of volatility.
Volume Analysis:
- On-Balance Volume (OBV): The OBV has shown a mixed trend, with some days experiencing selling pressure and others showing accumulation. This indicates indecision among market participants.
- Chaikin Money Flow (CMF): The CMF has been negative, indicating that money may be flowing out of the stock. This could signal a bearish sentiment among investors.
Conclusion:
Based on the analysis of the technical indicators, the stock of VRNS is currently exhibiting mixed signals. The trend indicators suggest a potential bullish bias, while momentum indicators point towards a neutral to bearish sentiment. Volatility is decreasing, indicating a possible consolidation phase, and volume indicators show indecision among investors.
Overall Assessment:
- Trend: Slight upward bias
- Momentum: Neutral to bearish
- Volatility: Decreasing, potential consolidation
- Volume: Indecisive
Recommendation:
Given the mixed signals from the technical indicators, it is advisable to exercise caution when trading VRNS in the upcoming days. Consider waiting for clearer signals or confirmation of a trend before making significant trading decisions. Keep a close eye on key support and resistance levels for potential breakout opportunities.