Technical Analysis of VSTA 2024-05-10
Overview:
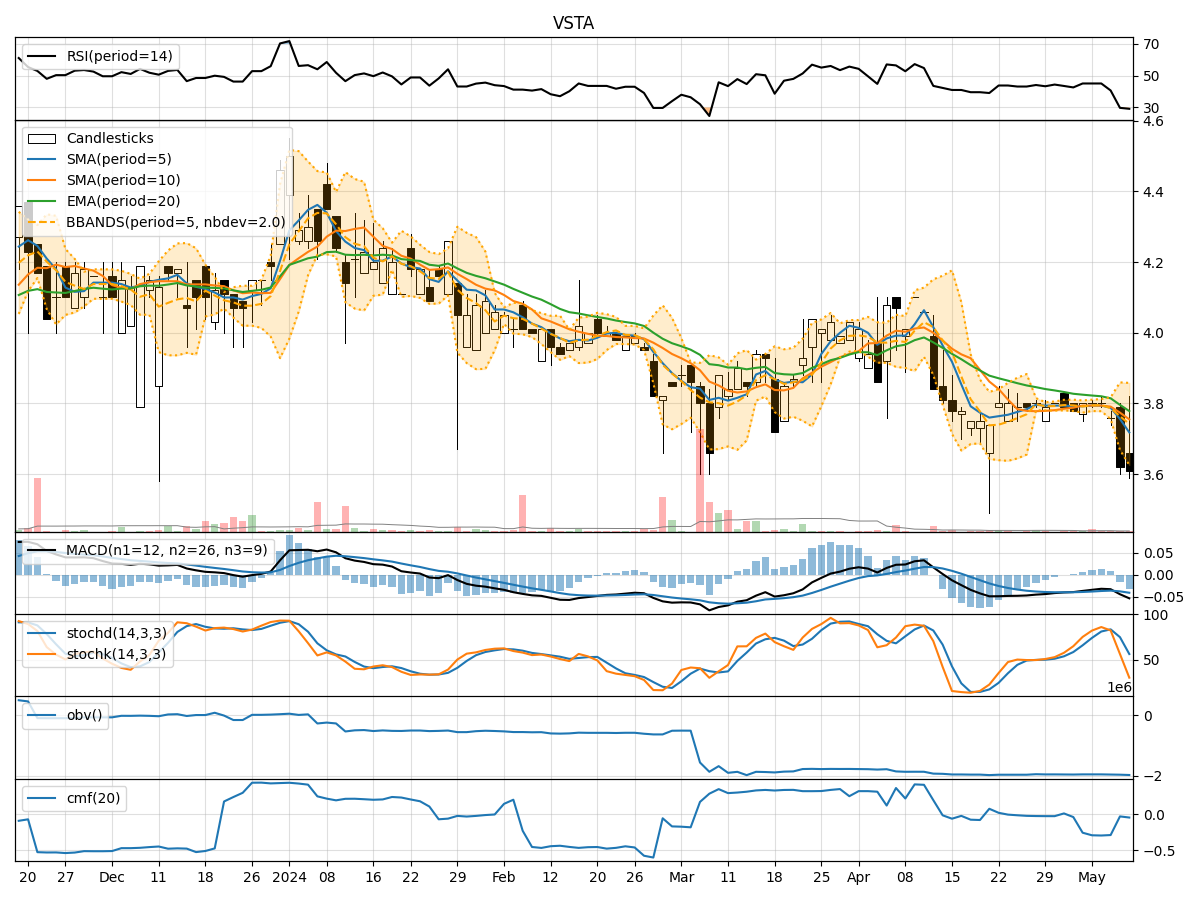
In analyzing the technical indicators for VSTA over the last 5 days, we will delve into the trend, momentum, volatility, and volume indicators to provide a comprehensive outlook on the possible stock price movement in the coming days.
Trend Analysis:
- Moving Averages (MA): The 5-day MA has been declining, indicating a short-term bearish trend.
- MACD: The MACD line has been consistently negative, suggesting a bearish momentum.
- RSI: The RSI has been decreasing, reflecting weakening buying pressure.
Momentum Analysis:
- Stochastic Oscillator: Both %K and %D have been decreasing, signaling a bearish momentum.
- Williams %R: The indicator has been in oversold territory, indicating a potential reversal.
Volatility Analysis:
- Bollinger Bands (BB): The bands have widened, suggesting increased volatility.
- BB %B: The %B has been decreasing, indicating a potential oversold condition.
Volume Analysis:
- On-Balance Volume (OBV): The OBV has been declining, indicating distribution.
- Chaikin Money Flow (CMF): The CMF has been negative, reflecting selling pressure.
Key Observations:
- The trend indicators, momentum oscillators, and volume indicators all point towards a bearish sentiment in the short term.
- Volatility has increased, potentially leading to larger price swings.
- The stock is currently oversold based on Williams %R.
Conclusion:
Based on the analysis of the technical indicators, the outlook for VSTA in the next few days is bearish. The stock is likely to experience further downward pressure, potentially leading to a continuation of the current downtrend. Traders and investors should exercise caution and consider waiting for signs of a reversal before considering long positions.