Technical Analysis of VUZI 2024-05-10
Overview:
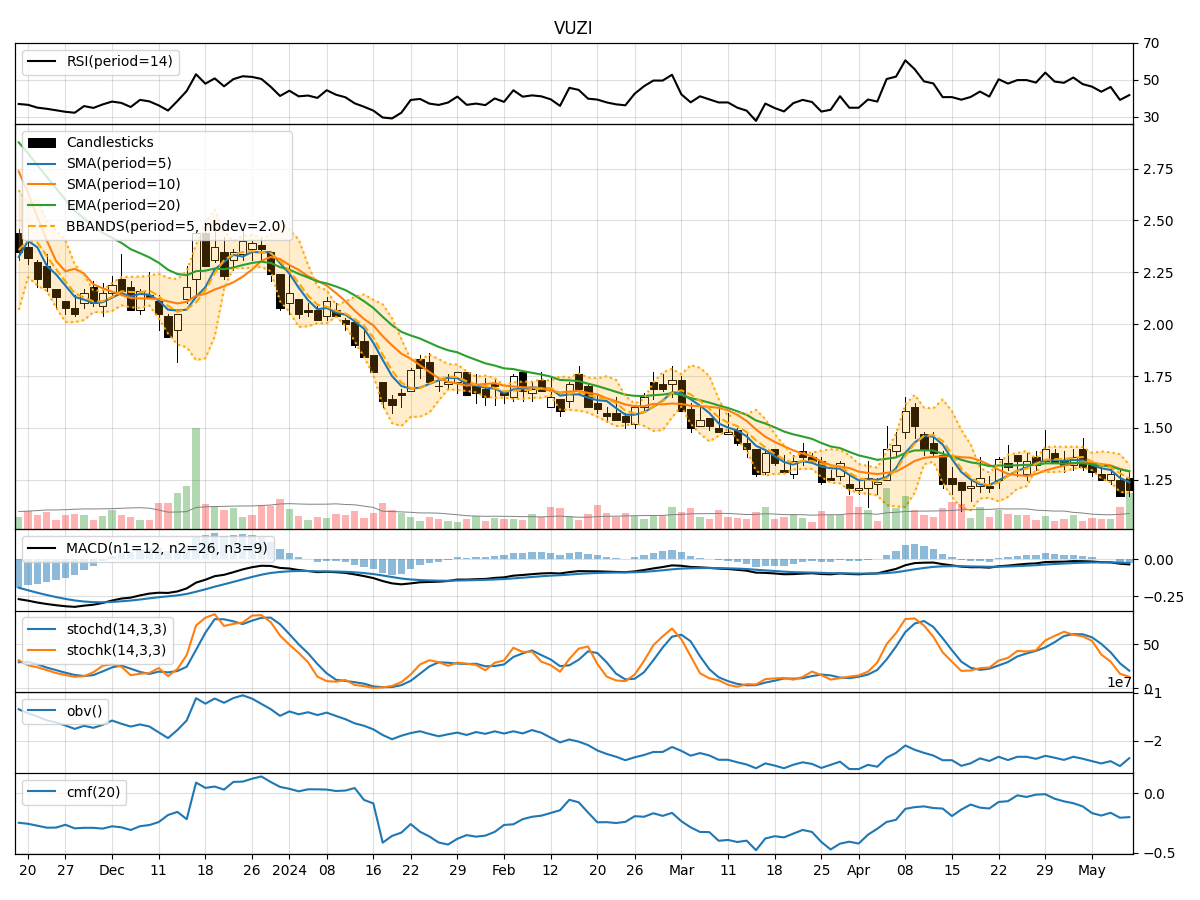
In analyzing the technical indicators for VUZI over the last 5 days, we will delve into the trend, momentum, volatility, and volume indicators to provide a comprehensive outlook on the possible stock price movement. By examining these key aspects, we aim to offer valuable insights and predictions for the upcoming days.
Trend Analysis:
- Moving Averages (MA): The 5-day MA has been consistently below the closing price, indicating a short-term downtrend.
- MACD: The MACD line has been below the signal line, suggesting a bearish momentum.
- EMA: The EMA has been declining, reflecting a weakening trend.
Key Observation: The trend indicators point towards a downward trajectory for VUZI.
Momentum Analysis:
- RSI: The RSI values have been below 50, indicating a bearish momentum.
- Stochastic Oscillator: Both %K and %D have been in the oversold territory, signaling a potential reversal.
- Williams %R: The indicator has been consistently in the oversold region, suggesting a bearish sentiment.
Key Observation: Momentum indicators suggest a bearish outlook for VUZI.
Volatility Analysis:
- Bollinger Bands (BB): The stock price has been trading within the lower Bollinger Band, indicating a period of low volatility.
- Bollinger %B: The %B value has been below 0.2, suggesting an oversold condition.
Key Observation: Volatility indicators imply a sideways movement or a potential reversal.
Volume Analysis:
- On-Balance Volume (OBV): The OBV has been declining, indicating selling pressure.
- Chaikin Money Flow (CMF): The CMF has been negative, reflecting a bearish trend in money flow.
Key Observation: Volume indicators support a bearish sentiment for VUZI.
Conclusion:
Based on the analysis of trend, momentum, volatility, and volume indicators, the overall outlook for VUZI in the next few days appears to be bearish. The stock is likely to continue its downward trend, supported by the negative momentum and volume indicators. However, the low volatility suggests a possible consolidation phase or a reversal in the near future. Traders should exercise caution and consider waiting for confirmation signals before making any trading decisions.
Key Conclusion:
The next few days for VUZI are likely to see further downside based on the technical indicators analyzed. Investors should closely monitor key support levels and wait for potential reversal signals before considering any bullish positions.