Technical Analysis of XP 2024-05-10
Overview:
In analyzing the technical indicators for XP stock over the last 5 days, we will delve into the trend, momentum, volatility, and volume indicators to provide a comprehensive outlook on the possible future stock price movement. By examining these key indicators, we aim to offer valuable insights and predictions for the upcoming trading days.
Trend Analysis:
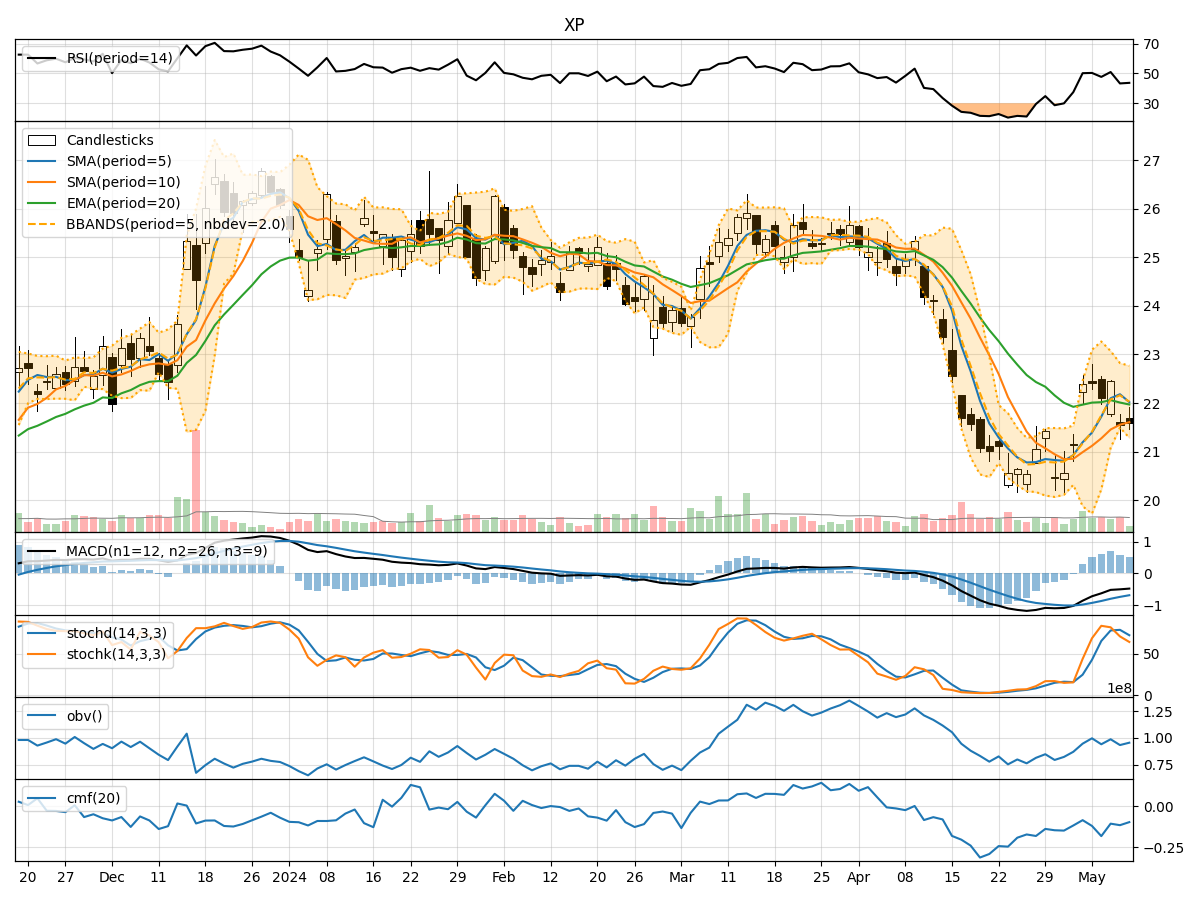
- Moving Averages (MA): The 5-day Moving Average (MA) has been consistently above the Simple Moving Average (SMA) and Exponential Moving Average (EMA), indicating a bullish trend.
- MACD: The MACD line has been negative but showing signs of convergence towards the signal line, suggesting a potential reversal in the bearish momentum.
- MACD Histogram: The MACD Histogram has been gradually decreasing, indicating a weakening bearish momentum.
Momentum Analysis:
- RSI: The Relative Strength Index (RSI) has been fluctuating around the 50 level, indicating a neutral momentum with no clear overbought or oversold conditions.
- Stochastic Oscillator: Both %K and %D lines of the Stochastic Oscillator have been declining, signaling a bearish momentum.
- Williams %R: The Williams %R indicator has been in the oversold territory, suggesting a potential reversal to the upside.
Volatility Analysis:
- Bollinger Bands (BB): The stock price has been trading within the Bollinger Bands, with the bands narrowing, indicating decreasing volatility.
- Bollinger %B: The %B indicator has been hovering around the middle range, suggesting a balanced volatility level.
Volume Analysis:
- On-Balance Volume (OBV): The OBV indicator has been fluctuating, indicating a lack of strong buying or selling pressure.
- Chaikin Money Flow (CMF): The CMF has been negative, reflecting a net outflow of money from the stock.
Key Observations:
- The trend indicators suggest a potential reversal in the bearish trend.
- Momentum indicators show mixed signals with a slight bearish bias.
- Volatility has been decreasing, indicating a possible period of consolidation.
- Volume indicators reflect a lack of significant buying or selling pressure.
Conclusion:
Based on the analysis of the technical indicators, the next few days for XP stock could see sideways movement with a slight upward bias. While the trend indicators hint at a potential reversal in the bearish trend, the momentum indicators remain mixed. The decreasing volatility and lack of strong volume support suggest a period of consolidation. Traders may consider cautious optimism in their approach towards XP stock in the upcoming trading sessions.