Technical Analysis of ZJYL 2024-05-10
Overview:
In analyzing the technical indicators for ZJYL stock over the last 5 days, we will delve into the trend, momentum, volatility, and volume indicators to provide a comprehensive outlook on the possible stock price movement in the coming days. By examining these key indicators, we aim to offer valuable insights and make informed predictions regarding the future direction of ZJYL stock.
Trend Analysis:
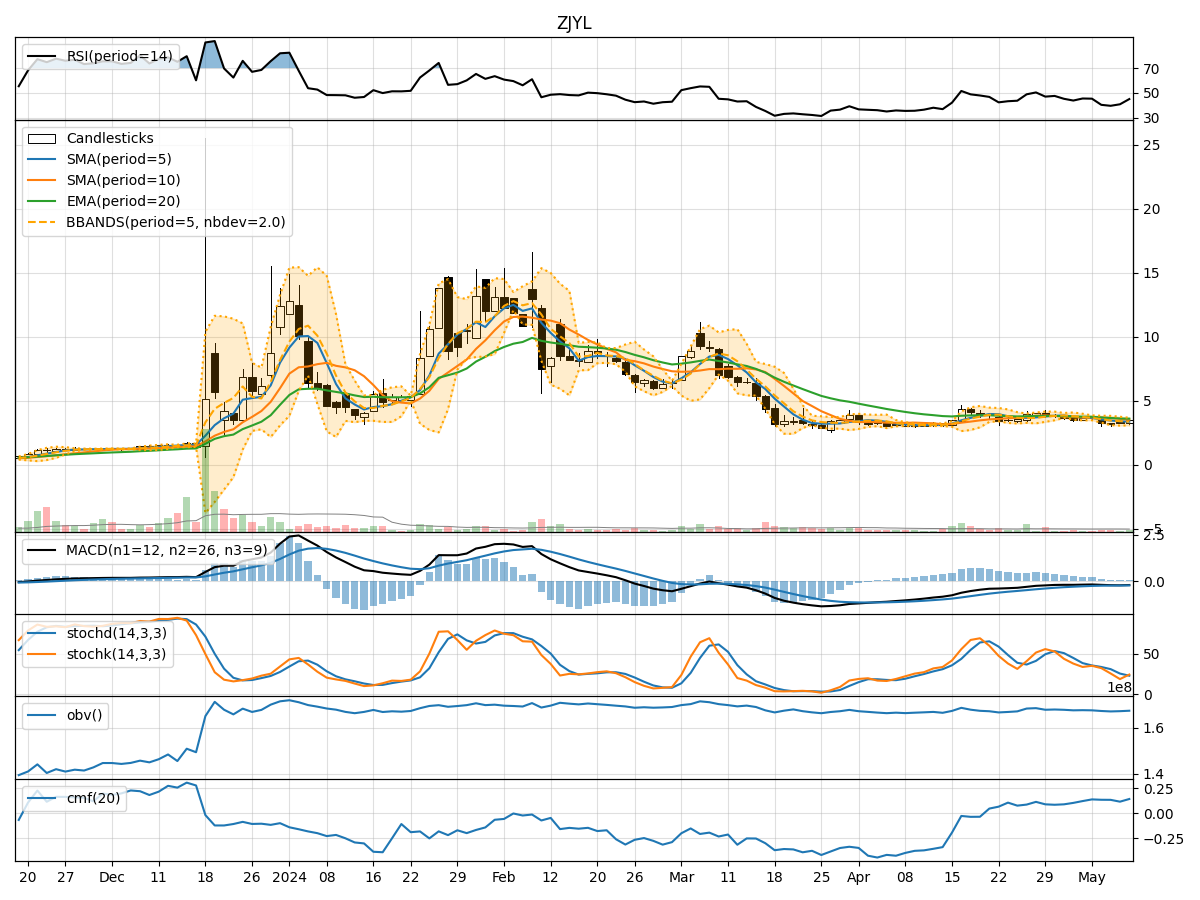
- Moving Averages (MA): The 5-day MA has been consistently below the closing price, indicating a short-term downtrend.
- MACD: The MACD line has been negative, suggesting bearish momentum in the stock.
- EMA: The EMA has been declining, further supporting the bearish trend.
Key Observation: The trend indicators point towards a downward trajectory for ZJYL stock.
Momentum Analysis:
- RSI: The RSI has been below 50, indicating bearish momentum in the stock.
- Stochastic Oscillator: Both %K and %D have been decreasing, signaling a potential continuation of the bearish momentum.
- Williams %R: The indicator has been in oversold territory, suggesting a bearish sentiment.
Key Observation: Momentum indicators reflect a bearish sentiment for ZJYL stock.
Volatility Analysis:
- Bollinger Bands: The stock price has been trading below the lower Bollinger Band, indicating oversold conditions.
- Bollinger %B: The %B value has been below 0.2, suggesting a potential reversal or bounce back.
- Volatility: The volatility has been increasing, indicating heightened price fluctuations.
Key Observation: Volatility indicators hint at a possible reversal or bounce back in the stock price.
Volume Analysis:
- On-Balance Volume (OBV): The OBV has been declining, signaling selling pressure in the stock.
- Chaikin Money Flow (CMF): The CMF has been positive but decreasing, indicating weakening buying pressure.
Key Observation: Volume indicators suggest a bearish sentiment in the stock.
Conclusion:
Based on the analysis of trend, momentum, volatility, and volume indicators, the overall outlook for ZJYL stock in the next few days appears to be bearish. The stock is likely to continue its downward trajectory, supported by the negative trend and momentum indicators, as well as the bearish sentiment in volume analysis. However, the increasing volatility and potential oversold conditions indicated by the Bollinger Bands could lead to a short-term reversal or bounce back before resuming the downtrend.
Key Conclusion: The next few days are likely to see ZJYL stock moving downward with a possibility of a short-term reversal based on volatility indicators. Investors should exercise caution and consider waiting for a clearer signal before making any trading decisions.