Technical Analysis of AMC 2024-05-03
Overview:
In analyzing the technical indicators for AMC over the last 5 days, we will delve into the trend, momentum, volatility, and volume indicators to provide a comprehensive outlook on the possible stock price movement. By examining these key factors, we aim to offer valuable insights and predictions for the upcoming days.
Trend Analysis:
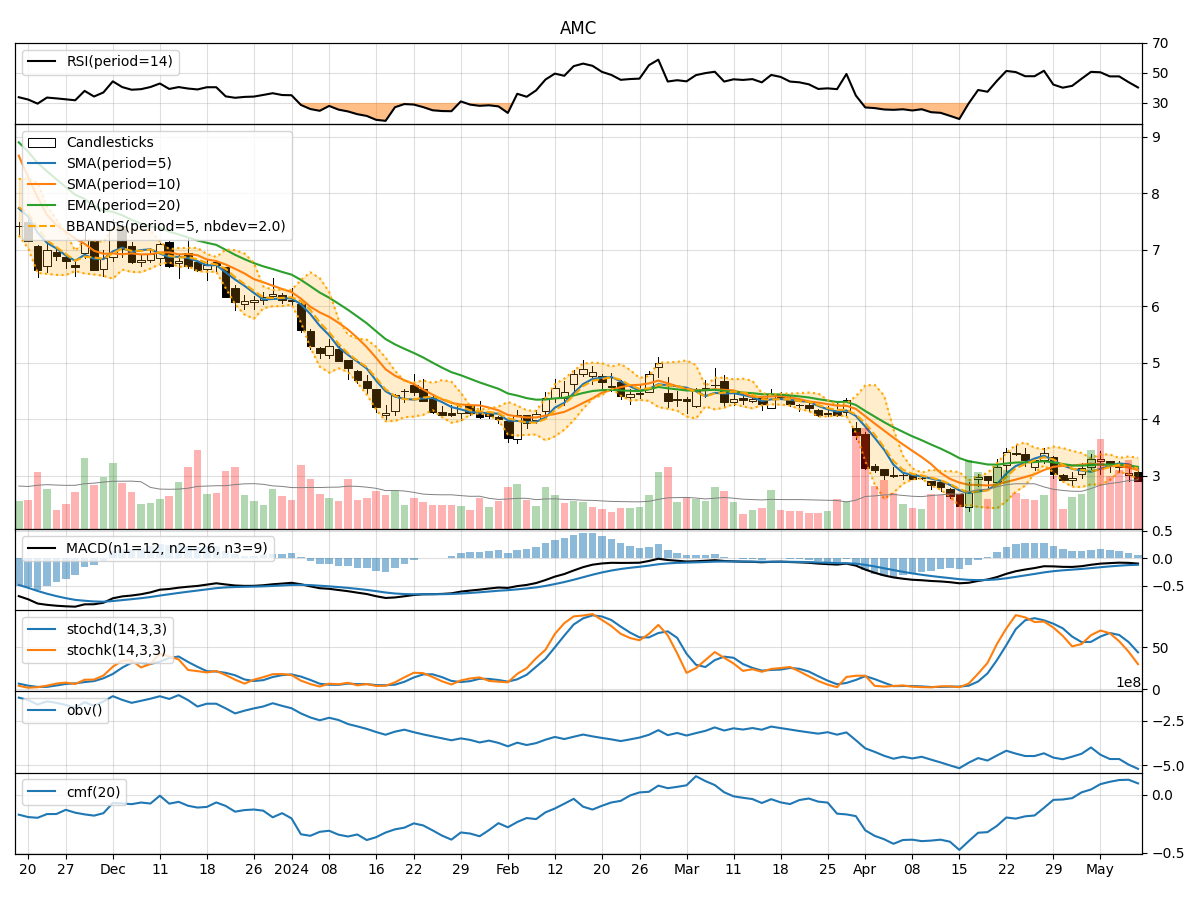
- Moving Averages (MA): The 5-day MA has been consistently below the closing price, indicating a short-term bearish trend.
- MACD: The MACD line has been below the signal line, suggesting a bearish momentum in the stock.
- EMA: The EMA has been declining, reflecting a downward trend in the stock price.
Momentum Analysis:
- RSI: The RSI has been gradually increasing but remains below the overbought threshold, indicating a potential for further upside.
- Stochastic Oscillator: Both %K and %D have shown upward movement, signaling a bullish momentum.
- Williams %R: The indicator has been moving towards the oversold region, suggesting a possible reversal to the upside.
Volatility Analysis:
- Bollinger Bands (BB): The stock price has been trading within the lower Bollinger Band, indicating a period of low volatility.
- Bollinger Band Width: The band width has been narrowing, suggesting a potential breakout or significant price movement ahead.
Volume Analysis:
- On-Balance Volume (OBV): The OBV has been declining, indicating selling pressure in the stock.
- Chaikin Money Flow (CMF): The CMF has been negative, reflecting a lack of buying interest in the stock.
Key Observations:
- The trend indicators point towards a bearish sentiment in the short term.
- Momentum indicators show a potential for a bullish reversal in the stock price.
- Volatility indicators suggest a period of low volatility with a potential breakout.
- Volume indicators indicate selling pressure and a lack of significant buying interest.
Conclusion:
Based on the analysis of the technical indicators, the next few days for AMC could see upward momentum as the momentum indicators signal a potential bullish reversal. However, the trend indicators still reflect a bearish sentiment, so we may witness consolidation or sideways movement in the stock price before a clear trend emerges. Traders should closely monitor the RSI, Stochastic Oscillator, and Bollinger Bands for potential entry and exit points in the market.