Technical Analysis of APD 2024-05-10
Overview:
In analyzing the technical indicators for APD over the last 5 days, we will delve into the trend, momentum, volatility, and volume indicators to provide a comprehensive outlook on the possible stock price movement in the coming days.
Trend Analysis:
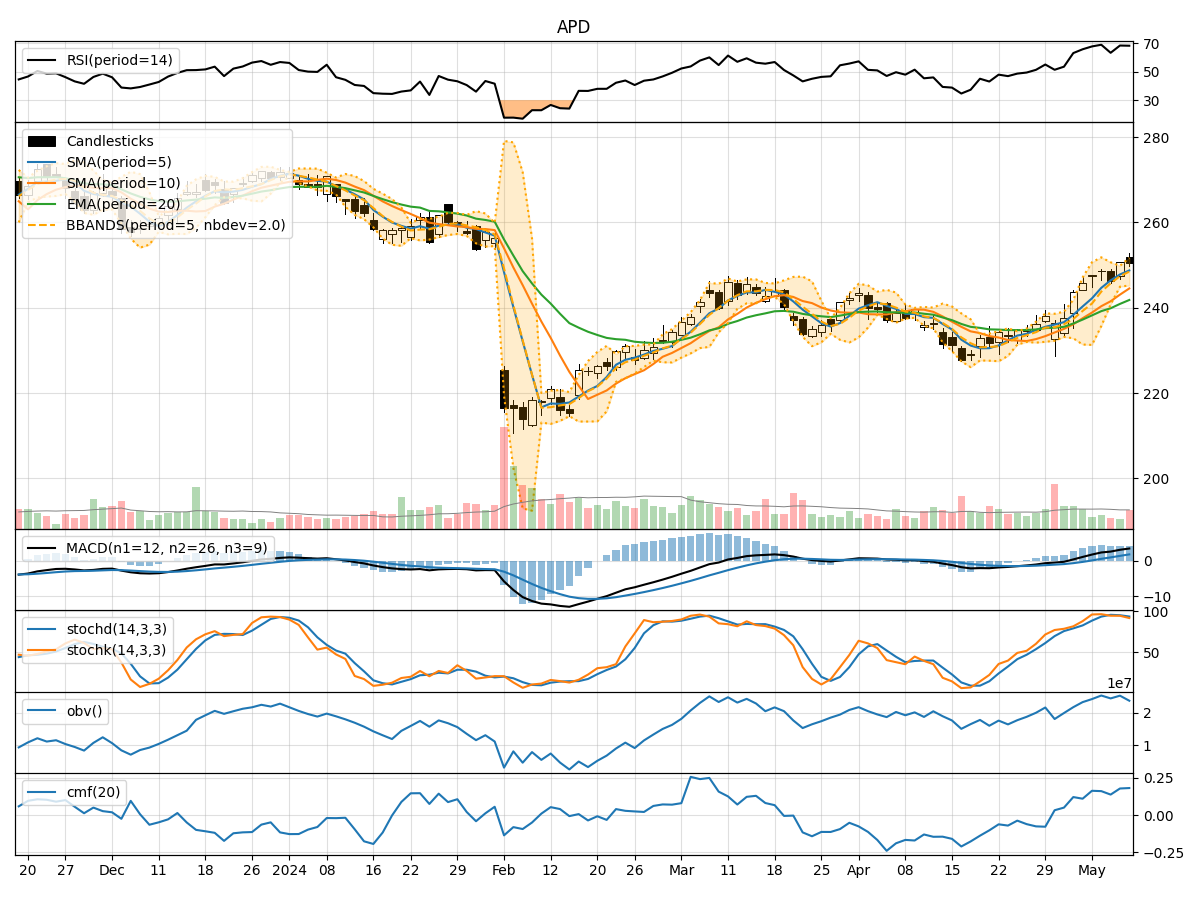
- Moving Averages (MA): The 5-day Moving Average has been consistently above the longer-term Simple Moving Average (SMA) and Exponential Moving Average (EMA), indicating a bullish trend.
- MACD: The MACD line has been consistently above the signal line, with both lines showing an upward trend, suggesting bullish momentum.
- RSI: The Relative Strength Index (RSI) has been hovering around 70, indicating overbought conditions but also reflecting strong bullish momentum.
Momentum Analysis:
- Stochastic Oscillator: The Stochastic Oscillator has been relatively high, indicating that the stock has been in overbought territory.
- Williams %R: The Williams %R is also showing overbought conditions, suggesting a potential reversal or consolidation.
Volatility Analysis:
- Bollinger Bands: The Bollinger Bands have been narrowing, indicating decreasing volatility and a potential upcoming breakout.
- Average True Range (ATR): ATR has been relatively stable, suggesting consistent price movements without significant spikes.
Volume Analysis:
- On-Balance Volume (OBV): The OBV has been fluctuating but generally showing an uptrend, indicating accumulation by investors.
- Chaikin Money Flow (CMF): The CMF has been positive, reflecting buying pressure in the stock.
Key Observations:
- The trend indicators suggest a strong bullish sentiment in the stock.
- Momentum indicators indicate overbought conditions, which might lead to a potential pullback or consolidation.
- Volatility has been decreasing, hinting at a possible period of consolidation before a breakout.
- Volume indicators show consistent accumulation by investors, supporting the bullish trend.
Conclusion:
Based on the analysis of the technical indicators, the stock is likely to experience a short-term consolidation phase due to overbought conditions indicated by momentum indicators. However, the overall trend remains bullish, supported by strong moving averages and positive volume indicators. Traders should watch for a potential breakout after the consolidation phase, with a high probability of upward movement in the near future.