Technical Analysis of BA 2024-05-10
Overview:
In analyzing the technical indicators for Boeing (BA) over the last 5 days, we will delve into the trends, momentum, volatility, and volume indicators to provide a comprehensive outlook on the possible stock price movement in the coming days.
Trend Analysis:
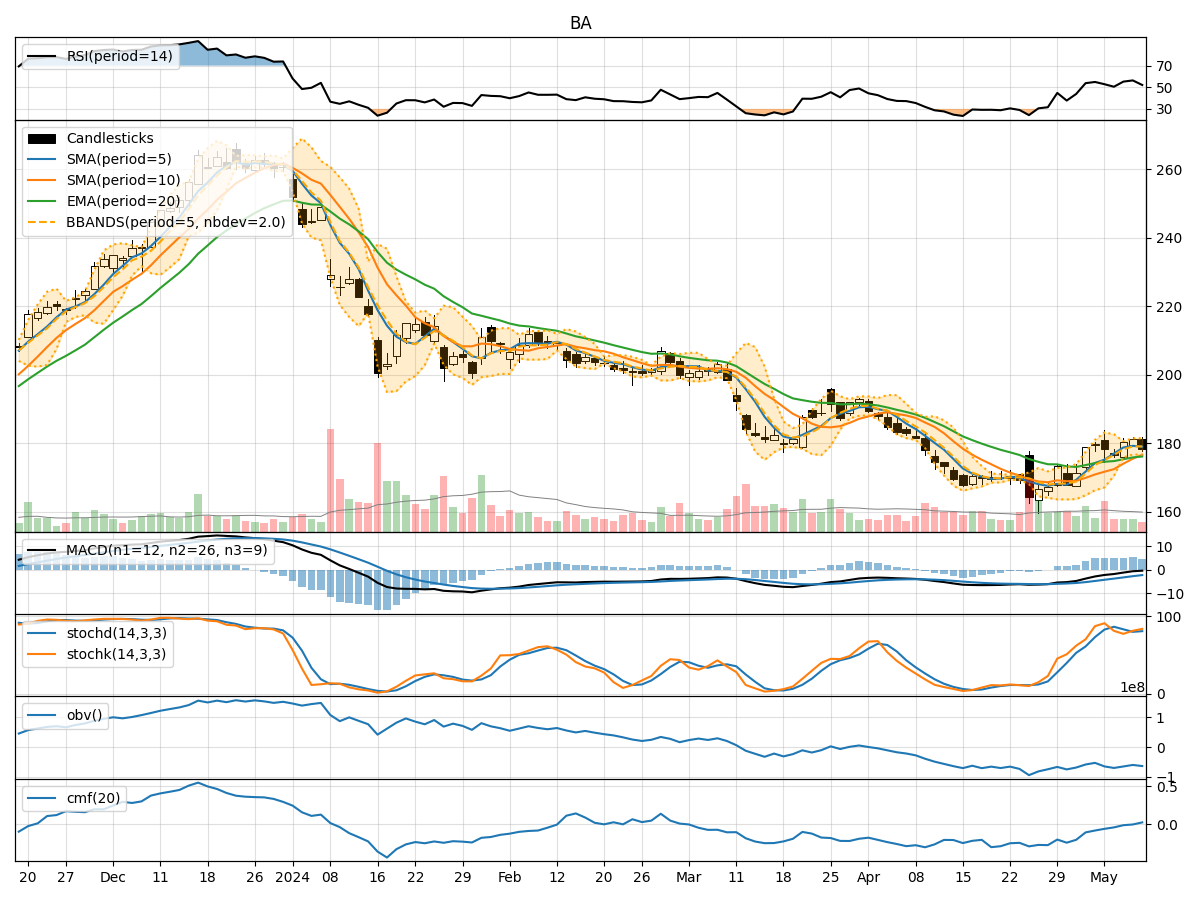
- Moving Averages (MA): The 5-day Moving Average (MA) has been showing a slight uptrend, indicating a positive momentum in the short term.
- MACD: The MACD line has been consistently above the signal line, suggesting a bullish trend.
- EMA: The Exponential Moving Average (EMA) has been trending upwards, supporting the bullish sentiment.
Momentum Analysis:
- RSI: The Relative Strength Index (RSI) has been fluctuating around the neutral zone, indicating a lack of strong momentum.
- Stochastic Oscillator: Both %K and %D have been in the overbought territory, suggesting a potential reversal or consolidation.
- Williams %R: The Williams %R is in the oversold region, signaling a possible buying opportunity.
Volatility Analysis:
- Bollinger Bands: The stock price has been trading within the Bollinger Bands, with the bands narrowing, indicating reduced volatility.
- Bollinger %B: The %B indicator is below 1, suggesting the stock is trading below the upper band.
Volume Analysis:
- On-Balance Volume (OBV): The OBV has been fluctuating, indicating indecision among investors.
- Chaikin Money Flow (CMF): The CMF has been negative, reflecting selling pressure in the stock.
Key Observations:
- The trend indicators suggest a bullish sentiment in the short term.
- Momentum indicators show mixed signals, with potential for a reversal or consolidation.
- Volatility has decreased, indicating a possible period of consolidation.
- Volume indicators reflect uncertainty and selling pressure in the market.
Conclusion:
Based on the analysis of the technical indicators, the next few days for Boeing (BA) stock price movement could be sideways with a slight upward bias. While the trend indicators are bullish, the mixed signals from momentum indicators and selling pressure indicated by volume indicators suggest a potential consolidation phase. Traders should closely monitor key support and resistance levels for potential entry and exit points.