Technical Analysis of BBD 2024-05-10
Overview:
In analyzing the technical indicators for BBD over the last 5 days, we will delve into the trend, momentum, volatility, and volume indicators to provide a comprehensive assessment of the stock's potential price movement. By examining these key factors, we aim to offer valuable insights and predictions for the next few days.
Trend Analysis:
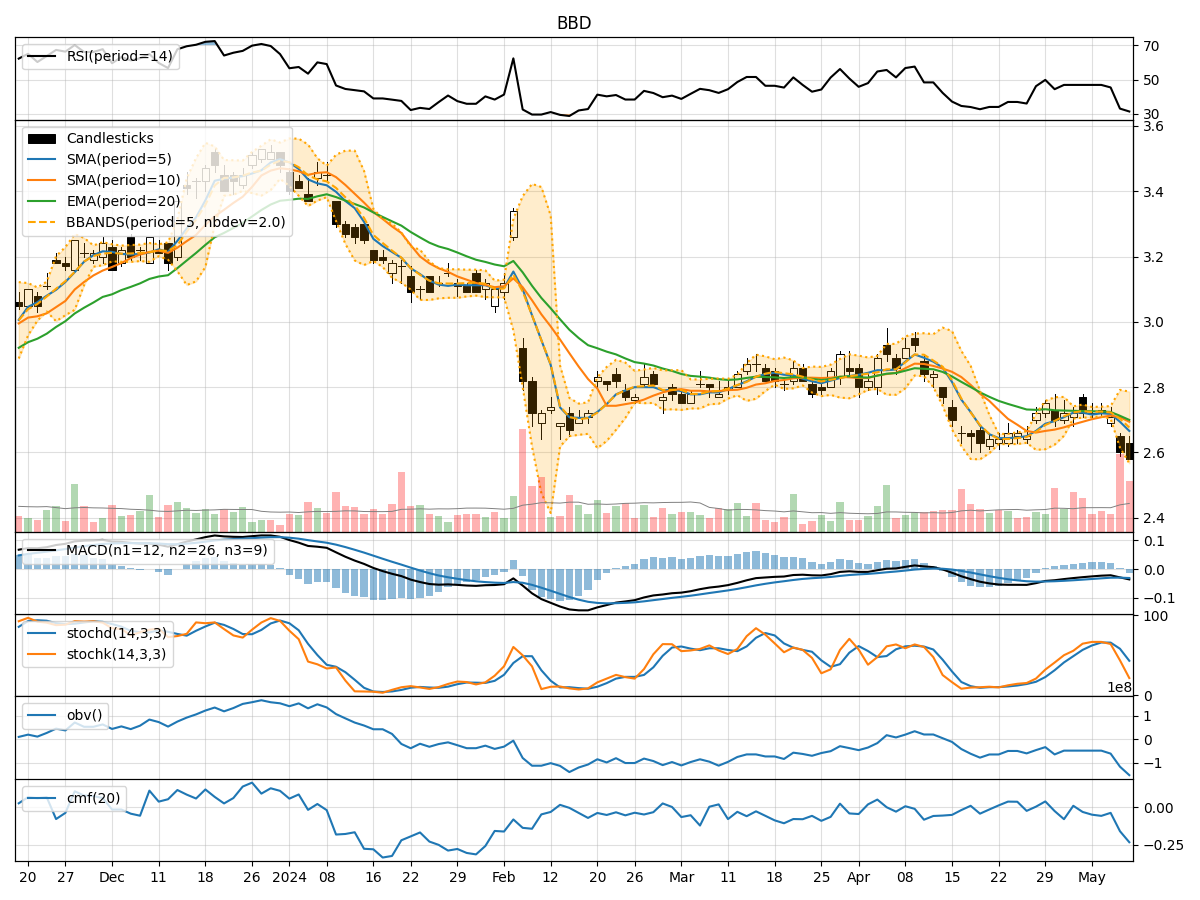
- Moving Averages (MA): The 5-day Moving Average (MA) has been gradually declining from 2.716 to 2.666, indicating a bearish trend.
- MACD: The Moving Average Convergence Divergence (MACD) has been consistently negative, suggesting downward momentum in the stock price.
- EMA: The Exponential Moving Average (EMA) has also been decreasing, further supporting the bearish trend.
Momentum Analysis:
- RSI: The Relative Strength Index (RSI) has dropped significantly from 47.52 to 31.49, indicating a decrease in buying pressure and potential oversold conditions.
- Stochastic Oscillator: Both %K and %D have been declining, signaling weakening momentum and potential selling pressure.
- Williams %R: The Williams %R has reached -100%, indicating an oversold condition.
Volatility Analysis:
- Bollinger Bands (BB): The Bollinger Bands have been narrowing, suggesting decreasing volatility in the stock price.
- BB %B: The %B indicator has been decreasing, indicating the price is approaching the lower band and potentially oversold conditions.
Volume Analysis:
- On-Balance Volume (OBV): The OBV has been fluctuating, but the overall trend has been negative, suggesting distribution and selling pressure.
- Chaikin Money Flow (CMF): The CMF has been consistently negative, indicating outflow of money from the stock.
Key Observations:
- The stock is currently in a downtrend based on moving averages, MACD, and EMA.
- Momentum indicators such as RSI and Stochastic Oscillator suggest oversold conditions and weakening buying pressure.
- Volatility is decreasing, indicating a potential consolidation phase.
- Volume indicators show distribution and selling pressure.
Conclusion:
Based on the analysis of technical indicators, the next few days' possible stock price movement for BBD is likely to be downward or sideways. The stock is currently in a bearish phase with oversold conditions, suggesting a potential for a short-term bounce or consolidation before further downside. Traders should exercise caution and consider waiting for confirmation of a reversal before considering long positions.