Technical Analysis of BHVN 2024-05-10
Overview:
In analyzing the technical indicators for BHVN over the last 5 days, we will delve into the trend, momentum, volatility, and volume indicators to provide a comprehensive outlook on the possible stock price movement. By examining these key aspects, we aim to offer valuable insights and predictions for the upcoming days.
Trend Analysis:
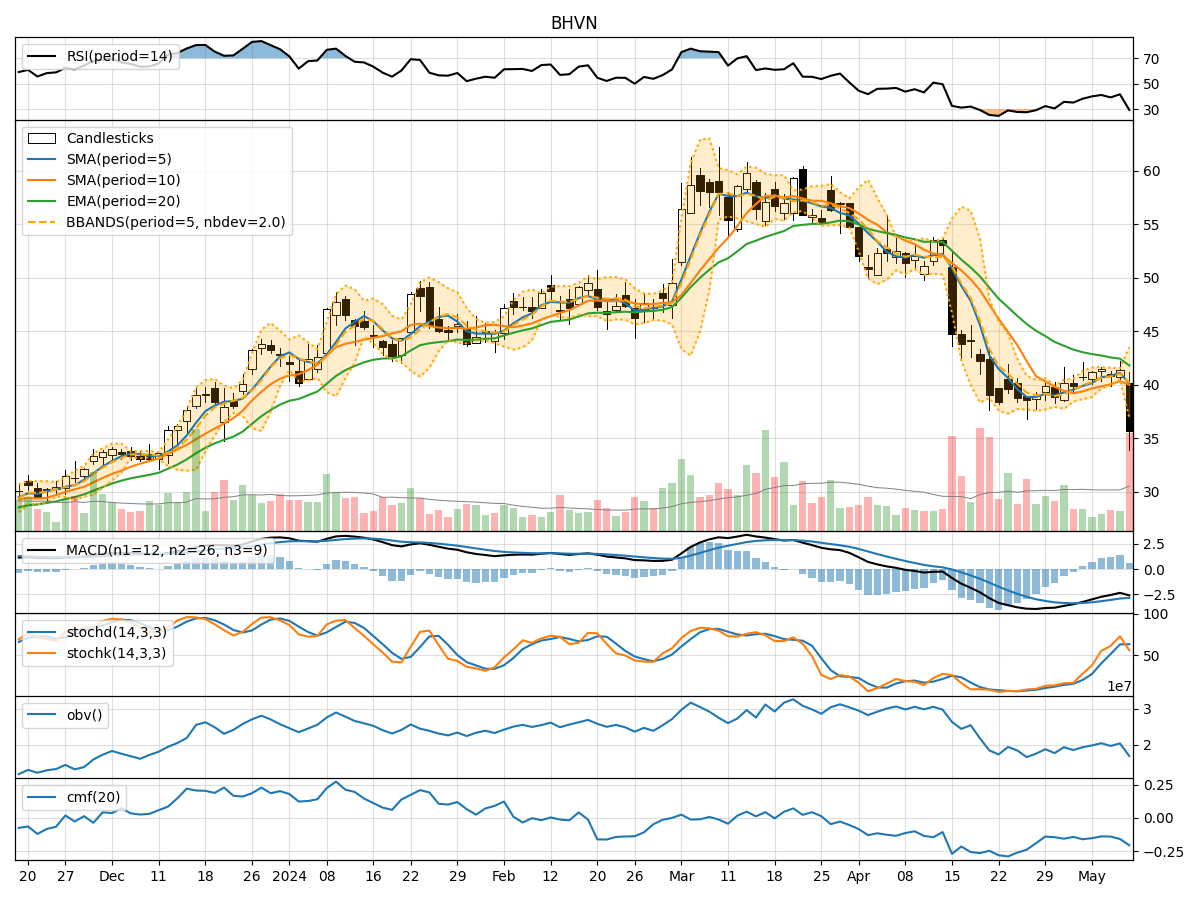
- Moving Averages (MA): The 5-day Moving Average (MA) has been fluctuating around the 40-41 range, indicating a relatively stable trend in the short term.
- MACD: The Moving Average Convergence Divergence (MACD) has shown a slight negative trend, with the MACD line consistently below the signal line, suggesting a bearish momentum.
- EMA: The Exponential Moving Average (EMA) has been declining, reflecting a downward trend in the stock price.
Key Observation: The trend indicators point towards a bearish sentiment in the short term.
Momentum Analysis:
- RSI: The Relative Strength Index (RSI) has been oscillating within the neutral range, indicating a lack of strong momentum either bullish or bearish.
- Stochastic Oscillator: Both %K and %D have shown mixed signals, with %K crossing %D multiple times, suggesting indecision in the market.
- Williams %R: The Williams %R is in oversold territory, indicating a potential reversal or bounce back in the stock price.
Key Observation: The momentum indicators suggest a sideways movement with a potential for a bullish reversal.
Volatility Analysis:
- Bollinger Bands: The Bollinger Bands have widened, indicating increased volatility in the stock price.
- Bollinger %B: The %B indicator is close to 0, suggesting the stock price is near the lower band, potentially indicating an oversold condition.
Key Observation: The volatility indicators signal a high volatility environment with a possibility of a reversal.
Volume Analysis:
- On-Balance Volume (OBV): The OBV has been consistently negative, indicating selling pressure in the stock.
- Chaikin Money Flow (CMF): The CMF is also negative, reflecting a lack of buying interest in the stock.
Key Observation: The volume indicators point towards bearish sentiment prevailing in the market.
Conclusion:
Based on the analysis of the technical indicators, the next few days for BHVN are likely to see a continued bearish trend in the short term, supported by the trend and volume indicators. However, the momentum indicators suggest a potential for a bullish reversal or a sideways consolidation in the near future. The high volatility observed could lead to sharp price movements, offering trading opportunities for both short-term traders and long-term investors.
Recommendation:
- Short-term Traders: Consider short positions or put options given the bearish trend and volume indicators.
- Long-term Investors: Monitor the momentum indicators for a potential bullish reversal before considering entry positions.
- Risk Management: Due to the high volatility, implement tight stop-loss orders to manage risk effectively.
In conclusion, while the overall outlook remains bearish, the potential for a reversal or consolidation should not be overlooked. Stay vigilant, adapt to changing market conditions, and make informed decisions based on the evolving technical signals.