Technical Analysis of BMY 2024-05-10
Overview:
In analyzing the technical indicators for BMY over the last 5 days, we will delve into the trend, momentum, volatility, and volume indicators to provide a comprehensive outlook on the possible stock price movement in the coming days. By examining these key aspects, we aim to offer valuable insights and predictions for potential investors.
Trend Indicators:
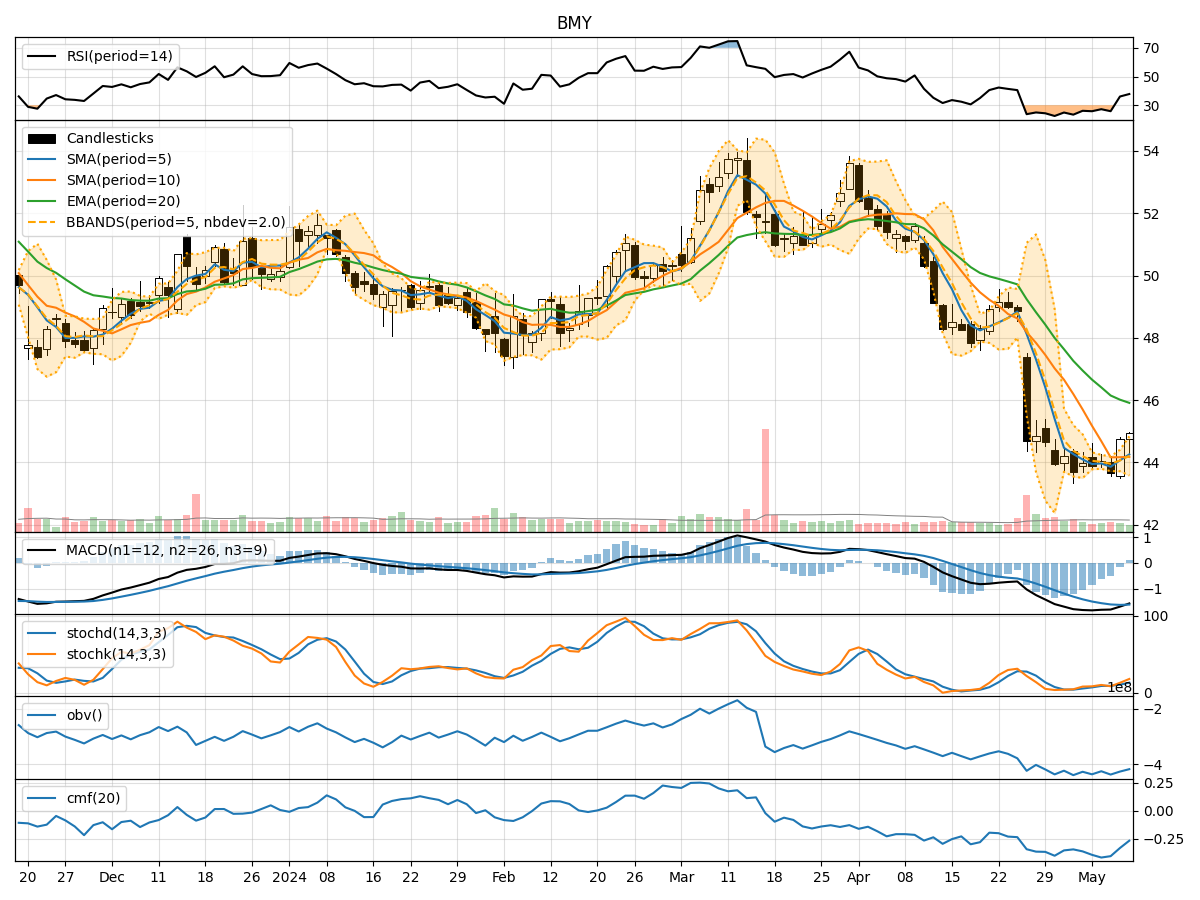
- Moving Averages (MA): The 5-day MA is below the 10-day SMA, indicating a short-term bearish trend. The EMA(20) is also declining, suggesting a weakening trend.
- MACD: The MACD line is below the signal line, with negative values, signaling a bearish momentum.
- Conclusion: The trend indicators point towards a downward trend for BMY.
Momentum Indicators:
- RSI: The RSI is below 50, indicating bearish momentum.
- Stochastic Oscillator: Both %K and %D are below 20, suggesting an oversold condition.
- Williams %R: The indicator is below -80, indicating an oversold condition.
- Conclusion: Momentum indicators suggest a bearish sentiment for BMY.
Volatility Indicators:
- Bollinger Bands: The price is currently below the lower Bollinger Band, indicating oversold conditions.
- Conclusion: Volatility indicators suggest a potential reversal or consolidation in the near term.
Volume Indicators:
- On-Balance Volume (OBV): The OBV is declining, indicating selling pressure.
- Chaikin Money Flow (CMF): The CMF is negative, suggesting outflow of money from the stock.
- Conclusion: Volume indicators support the bearish sentiment for BMY.
Conclusion:
Based on the analysis of trend, momentum, volatility, and volume indicators, the overall outlook for BMY in the next few days is bearish. The trend is downward, momentum is bearish, and volume indicators confirm selling pressure. However, the oversold conditions indicated by volatility indicators may lead to a potential reversal or consolidation in the near term.
Recommendation:
- Short-term Traders: Consider short positions or staying on the sidelines until a clearer trend emerges.
- Long-term Investors: Monitor the stock closely for potential entry points during a reversal or consolidation phase.
Disclaimer:
It is important to note that technical analysis is not a guaranteed predictor of future price movements. Market dynamics can change rapidly, and it is essential to consider other fundamental factors before making investment decisions. Consult with a financial advisor for personalized advice tailored to your investment goals and risk tolerance.