Technical Analysis of BRFS 2024-05-10
Overview:
In analyzing the technical indicators for BRFS over the last 5 days, we will delve into the trend, momentum, volatility, and volume indicators to provide a comprehensive outlook on the possible stock price movement. By examining these key aspects, we aim to offer valuable insights and predictions for the upcoming days.
Trend Analysis:
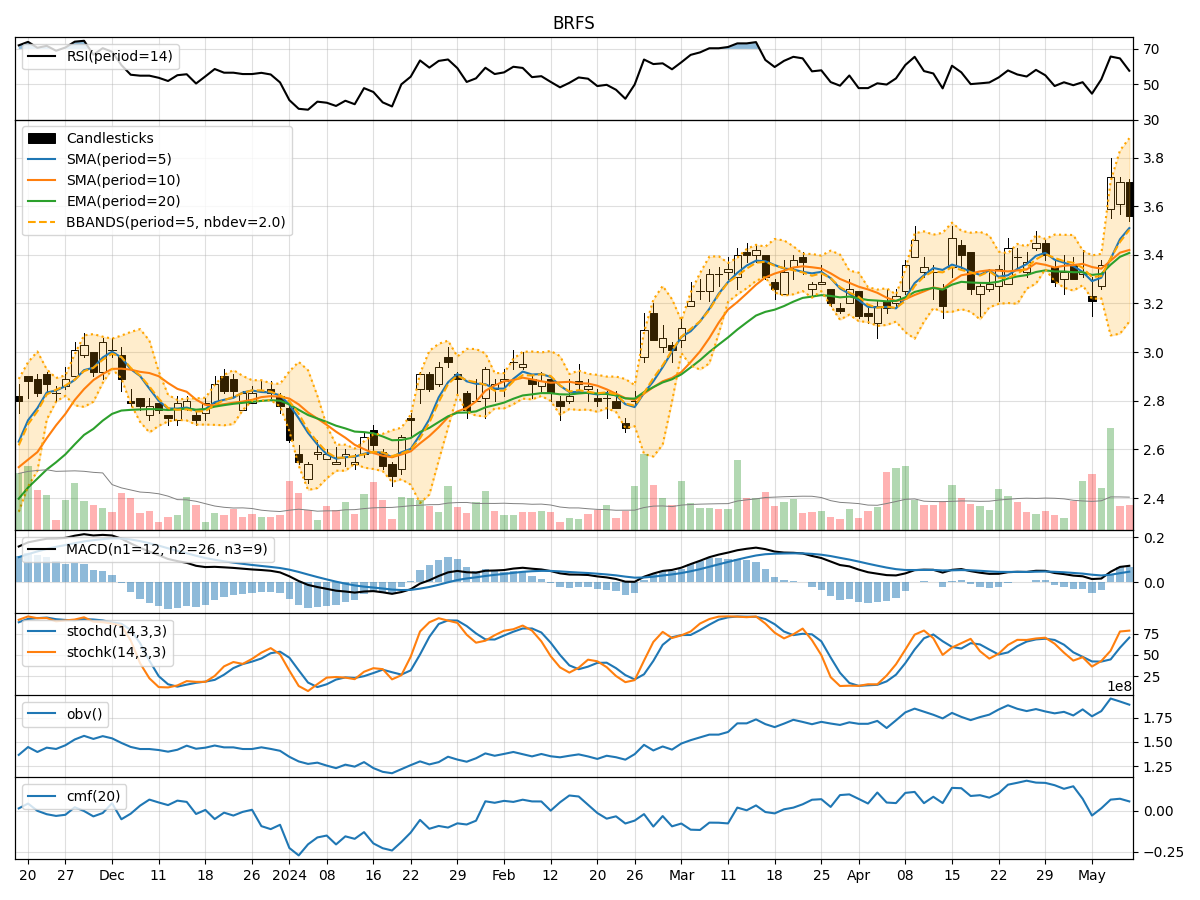
- Moving Averages (MA): The 5-day MA has been fluctuating around the closing prices, indicating short-term price trends. The SMA(10) and EMA(20) have shown a slight upward trend, suggesting potential bullish momentum.
- MACD: The MACD line has been consistently positive, with the MACD histogram showing an increasing trend, indicating strengthening bullish momentum.
Momentum Analysis:
- RSI: The RSI has been fluctuating within the neutral zone, suggesting a balanced momentum between buying and selling pressure.
- Stochastic Oscillator: Both %K and %D have been in the overbought zone, indicating a potential reversal in price direction.
- Williams %R: The indicator has been in the oversold territory, signaling a possible bullish reversal.
Volatility Analysis:
- Bollinger Bands (BB): The bands have been widening, indicating increased price volatility. The current price is closer to the upper band, suggesting a potential overbought condition.
- Bollinger %B: The %B indicator has been fluctuating, indicating potential shifts in price momentum.
Volume Analysis:
- On-Balance Volume (OBV): The OBV has shown mixed signals, reflecting indecision among market participants.
- Chaikin Money Flow (CMF): The CMF has been positive, indicating potential buying pressure in the market.
Key Observations:
- The trend indicators suggest a potential bullish bias in the short term.
- Momentum indicators show conflicting signals, with RSI neutral, Stochastic overbought, and Williams %R oversold.
- Volatility indicators point towards increased price fluctuations and a potential overbought condition.
- Volume indicators reflect mixed sentiment among investors.
Conclusion:
Based on the analysis of the technical indicators, the next few days' possible stock price movement for BRFS could see further upside potential in the short term. However, caution is advised due to conflicting signals from momentum indicators and the potential overbought condition indicated by volatility indicators. Traders should closely monitor price action and key support/resistance levels for better decision-making.
Recommendation:
- Short-term Traders: Consider taking advantage of potential bullish momentum but remain vigilant for signs of a reversal.
- Long-term Investors: Monitor the price action closely and consider waiting for more clarity in market direction before making significant investment decisions.
Remember, market dynamics can change rapidly, so it's essential to stay informed and adapt your strategies accordingly.