Technical Analysis of BRK.A 2024-05-10
Overview:
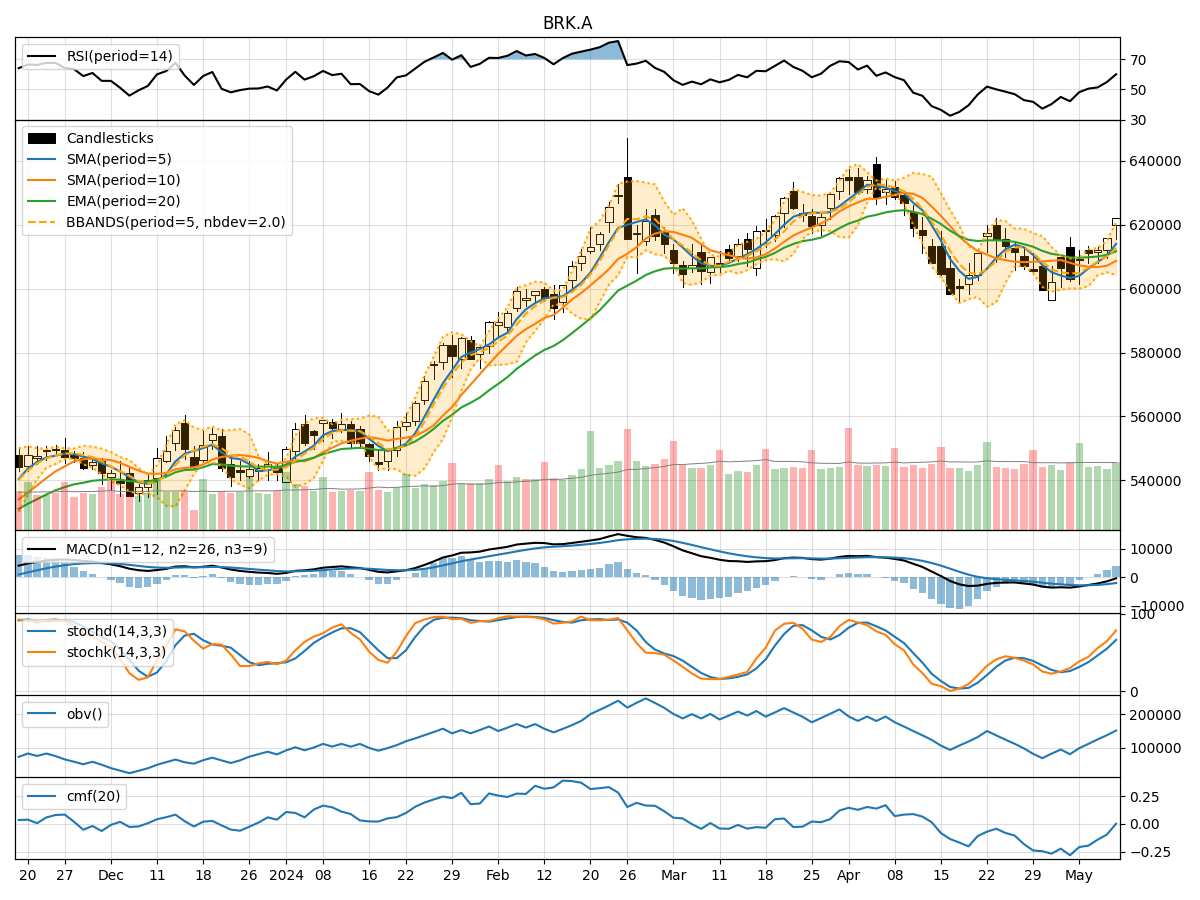
In the last 5 trading days, BRK.A stock has shown a consistent uptrend in both price and volume. The moving averages have been trending upwards, indicating a bullish sentiment. Momentum indicators like RSI and Stochastic oscillators are also showing strength in the current trend. Volatility indicators suggest a widening of the Bollinger Bands, potentially indicating increased price movement. However, the volume indicators show a slight decrease in On-Balance Volume (OBV) and Chaikin Money Flow (CMF), which could be a point of concern.
Trend Indicators Analysis:
- Moving Averages (MA): The 5-day MA has been consistently above the 10-day SMA, indicating a short-term bullish trend. The EMA(20) is also trending upwards, supporting the bullish sentiment.
- MACD: The MACD line has been above the signal line for the past 5 days, indicating a bullish momentum in the stock price.
Key Observation: The trend indicators suggest a strong bullish trend in the stock price.
Momentum Indicators Analysis:
- RSI: The RSI has been increasing and is currently in the overbought territory, indicating a strong bullish momentum.
- Stochastic Oscillators: Both %K and %D lines are in the overbought zone, suggesting a continuation of the bullish momentum.
Key Observation: Momentum indicators confirm the bullish sentiment in the stock.
Volatility Indicators Analysis:
- Bollinger Bands (BB): The widening of the Bollinger Bands suggests an increase in price volatility, potentially leading to larger price movements.
Key Observation: Volatility indicators point towards potential increased price movement in the stock.
Volume Indicators Analysis:
- On-Balance Volume (OBV): The OBV has shown a slight decrease over the last 5 days, indicating a divergence between price and volume.
- Chaikin Money Flow (CMF): The CMF has also decreased, suggesting a weakening buying pressure.
Key Observation: Volume indicators show a slight divergence from the bullish trend seen in price and momentum indicators.
Conclusion:
Based on the analysis of the technical indicators, the next few days' possible stock price movement for BRK.A is likely to continue in an upward direction. The strong bullish trend indicated by the moving averages, MACD, RSI, and Stochastic oscillators, coupled with the widening Bollinger Bands, suggests that the stock price may experience further upside potential. However, the slight decrease in volume indicators like OBV and CMF could be a point of caution, indicating a need to monitor for any signs of weakening buying pressure.
Overall, the outlook for BRK.A stock is bullish with a potential for further price appreciation in the coming days.