Technical Analysis of BUD 2024-05-10
Overview:
In analyzing the technical indicators for BUD over the last 5 days, we will delve into the trend, momentum, volatility, and volume indicators to provide a comprehensive outlook on the possible stock price movement in the coming days. By examining these key indicators, we aim to offer valuable insights and predictions for potential investors.
Trend Analysis:
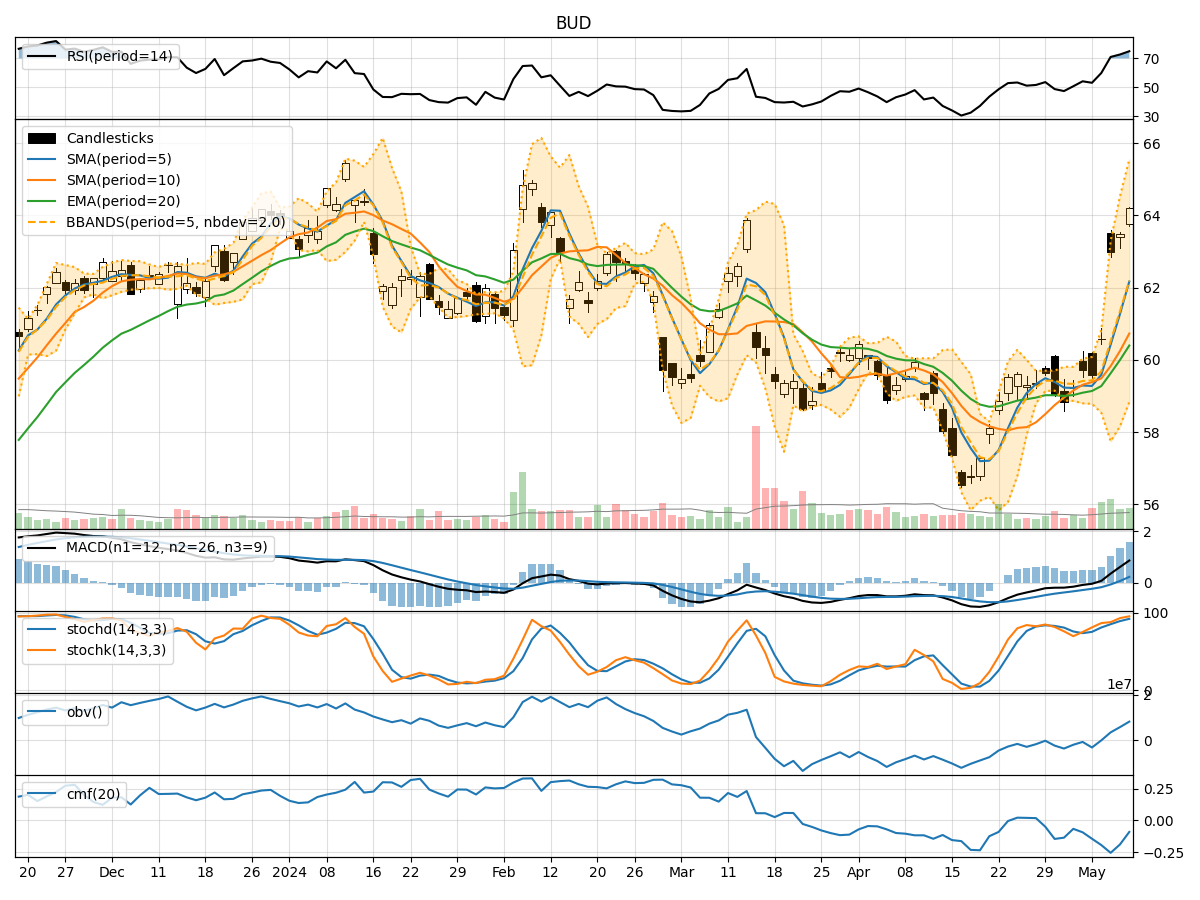
- Moving Averages (MA): The 5-day Moving Average has been consistently rising, indicating a bullish trend in the short term.
- MACD: The MACD line has been above the signal line for the past few days, suggesting a bullish momentum.
- RSI: The Relative Strength Index has been trending upwards, reaching overbought levels, signaling a strong bullish sentiment.
Key Observation: The trend indicators point towards a strong bullish trend in the stock price.
Momentum Analysis:
- Stochastic Oscillator: Both %K and %D have been in the overbought zone, indicating a strong buying momentum.
- Williams %R: The Williams %R is also in the oversold region, supporting the bullish momentum.
Key Observation: Momentum indicators align with the bullish sentiment, indicating a continuation of the upward momentum.
Volatility Analysis:
- Bollinger Bands: The stock price has been consistently trading above the upper Bollinger Band, suggesting high volatility and potential overbought conditions.
- Volatility Bands: The width of the bands has been expanding, indicating increased price volatility.
Key Observation: High volatility levels may lead to a potential pullback or correction in the stock price.
Volume Analysis:
- On-Balance Volume (OBV): The OBV has been declining, indicating a decrease in buying pressure.
- Chaikin Money Flow (CMF): The CMF has been negative, suggesting a lack of buying interest.
Key Observation: The declining volume indicators may signal a weakening of the bullish trend.
Conclusion:
Based on the analysis of the technical indicators, the next few days' possible stock price movement for BUD is likely to experience a short-term pullback or correction. While the trend and momentum indicators suggest a bullish sentiment, the high volatility levels and declining volume indicators raise concerns about a potential reversal in the stock price. Investors should exercise caution and consider waiting for a better entry point before initiating new positions.
Recommendation:
- Short-term Traders: Consider taking profits or setting tight stop-loss orders to protect gains.
- Long-term Investors: Monitor the price action closely and wait for a more favorable entry point before adding to positions.
Overall View: Bearish with a potential short-term correction in the stock price.