Technical Analysis of CIB 2024-05-31
Overview:
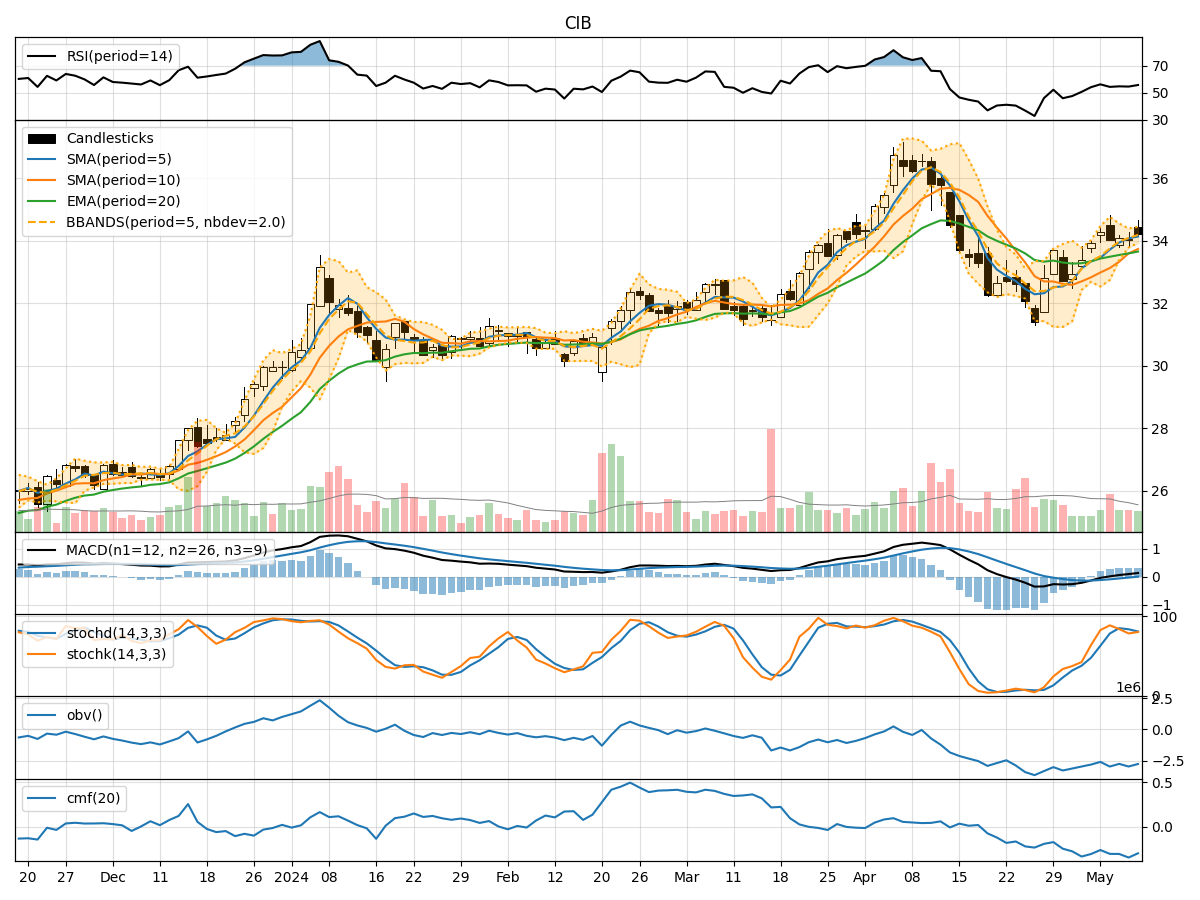
In analyzing the technical indicators for CIB stock over the last 5 days, we will delve into the trend, momentum, volatility, and volume indicators to provide a comprehensive outlook on the possible future stock price movement. By examining these key indicators, we aim to offer valuable insights and predictions for the upcoming trading days.
Trend Analysis:
- Moving Averages (MA): The 5-day MA has been consistently below the closing prices, indicating a short-term downtrend.
- MACD: The MACD line has been above the signal line, suggesting a bullish momentum.
- EMA: The EMA has been relatively stable, reflecting a neutral trend.
Momentum Analysis:
- RSI: The RSI has been fluctuating around the 50 level, indicating a lack of strong momentum.
- Stochastic Oscillator: Both %K and %D have been trending downwards, signaling a potential bearish momentum.
- Williams %R: The indicator has been in oversold territory, suggesting a possible reversal.
Volatility Analysis:
- Bollinger Bands (BB): The stock price has been trading within the bands, indicating a period of consolidation.
- Bollinger %B: The %B indicator has been fluctuating around the midline, reflecting a balanced volatility.
Volume Analysis:
- On-Balance Volume (OBV): The OBV has been declining, indicating selling pressure in the stock.
- Chaikin Money Flow (CMF): The CMF has been negative, suggesting a lack of buying interest.
Key Observations:
- The trend indicators show a mixed picture with a short-term downtrend but a bullish MACD.
- Momentum indicators point towards a potential bearish momentum with oversold conditions.
- Volatility indicators suggest a period of consolidation with balanced volatility.
- Volume indicators indicate selling pressure and a lack of significant buying interest.
Conclusion:
Based on the analysis of the technical indicators, the stock price of CIB is likely to experience further downward movement in the next few days. The bearish momentum indicated by the stochastic oscillator and oversold conditions in the Williams %R signal a potential continuation of the downtrend. Additionally, the declining OBV and negative CMF highlight the prevailing selling pressure in the stock. Traders and investors should exercise caution and consider short-term bearish strategies in anticipation of a downward price movement.