Technical Analysis of CIG 2024-05-10
Overview:
In analyzing the technical indicators for CIG over the last 5 days, we will delve into the trend, momentum, volatility, and volume indicators to provide a comprehensive outlook on the possible stock price movement in the coming days. By examining these key aspects, we aim to offer valuable insights and predictions to guide investment decisions.
Trend Analysis:
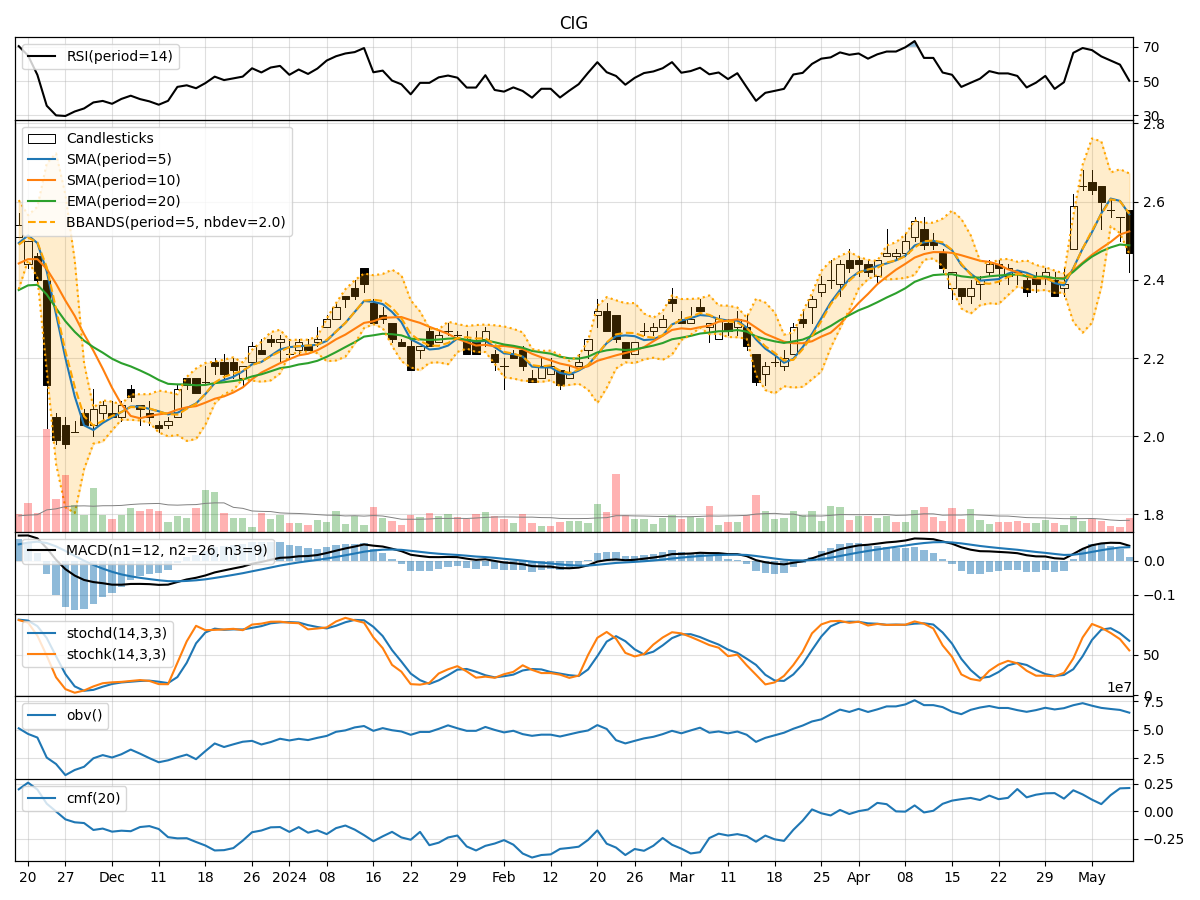
- Moving Averages (MA): The 5-day MA has been fluctuating around the closing prices, indicating short-term price trends. The SMA(10) and EMA(20) have shown a slight upward trend, suggesting potential bullish momentum.
- MACD: The MACD line has been positive, indicating a bullish trend. The MACD Histogram has been increasing, signaling strengthening bullish momentum.
Momentum Analysis:
- RSI: The RSI has been gradually decreasing but remains above 50, indicating a neutral to slightly bearish momentum.
- Stochastic Oscillator: Both %K and %D have been declining, suggesting a bearish sentiment in the short term.
- Williams %R: The indicator has been in the oversold territory, indicating a potential reversal or consolidation phase.
Volatility Analysis:
- Bollinger Bands (BB): The bands have been narrowing, indicating decreasing volatility. The price has been trading within the bands, suggesting a period of consolidation.
- Bollinger %B: The %B indicator has been decreasing, signaling a potential price reversal or consolidation phase.
Volume Analysis:
- On-Balance Volume (OBV): The OBV has been declining, indicating selling pressure in the market.
- Chaikin Money Flow (CMF): The CMF has been positive, suggesting buying pressure in the market.
Key Observations:
- The trend indicators show a potential bullish bias in the short term.
- Momentum indicators suggest a neutral to slightly bearish sentiment.
- Volatility indicators point towards a period of consolidation.
- Volume indicators indicate a mix of buying and selling pressure in the market.
Conclusion:
Based on the analysis of the technical indicators, the next few days for CIG stock price movement could see sideways consolidation with a slight bullish bias. Traders may expect the stock to trade within a range with limited price movements. It is advisable to closely monitor key support and resistance levels for potential breakout opportunities.