Technical Analysis of CPNG 2024-05-10
Overview:
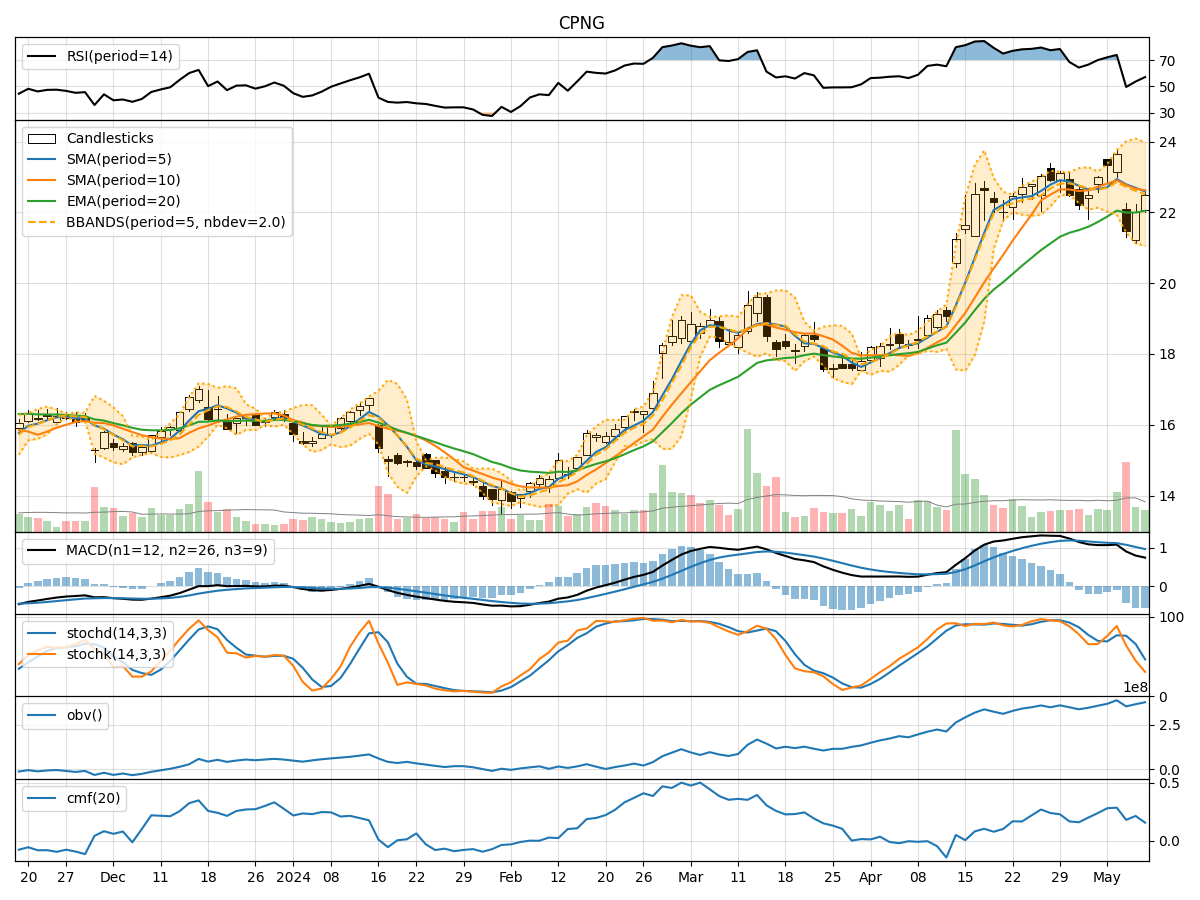
In analyzing the technical indicators for CPNG over the last 5 days, we will delve into the trend, momentum, volatility, and volume indicators to provide a comprehensive outlook on the possible stock price movement in the coming days.
Trend Analysis:
- Moving Averages (MA): The 5-day Moving Average (MA) has been fluctuating around the stock price, indicating short-term price trends. The Simple Moving Average (SMA) and Exponential Moving Average (EMA) show a slight divergence, suggesting potential volatility.
- MACD: The Moving Average Convergence Divergence (MACD) has been negative, with the MACD line below the signal line, indicating a bearish trend.
- Conclusion: The trend indicators suggest a bearish sentiment in the short term.
Momentum Analysis:
- RSI: The Relative Strength Index (RSI) has been fluctuating in the overbought and oversold zones, indicating potential price reversals.
- Stochastic Oscillator: Both %K and %D have been declining, suggesting weakening momentum.
- Conclusion: The momentum indicators point towards a bearish momentum in the short term.
Volatility Analysis:
- Bollinger Bands (BB): The Bollinger Bands have been narrowing, indicating decreasing volatility.
- Conclusion: Volatility is decreasing, suggesting a consolidation phase in the stock price.
Volume Analysis:
- On-Balance Volume (OBV): The OBV has been relatively stable, indicating a balance between buying and selling pressure.
- Chaikin Money Flow (CMF): The CMF has been positive but decreasing, suggesting weakening buying pressure.
- Conclusion: Volume indicators show a neutral stance with a slight bearish bias.
Overall Conclusion:
Based on the analysis of trend, momentum, volatility, and volume indicators, the overall outlook for CPNG in the next few days is bearish. The trend and momentum indicators both point towards a downward movement, while volatility indicates a consolidation phase. Volume indicators suggest a neutral stance with a slight bearish bias.
Recommendation:
Considering the bearish sentiment in the trend and momentum indicators, investors may consider caution in their trading decisions. It is advisable to closely monitor price movements and key support levels. Short-term traders might look for potential entry points during price retracements, while long-term investors may evaluate the fundamental aspects alongside technical indicators for a comprehensive investment strategy.
Disclaimer:
Please note that technical analysis is not a guaranteed predictor of future price movements, and market dynamics can change rapidly. It is essential to conduct thorough research and consider multiple factors before making any investment decisions. Consulting with a financial advisor or conducting further analysis based on real-time data is recommended for tailored investment strategies.