Technical Analysis of DELL 2024-05-10
Overview:
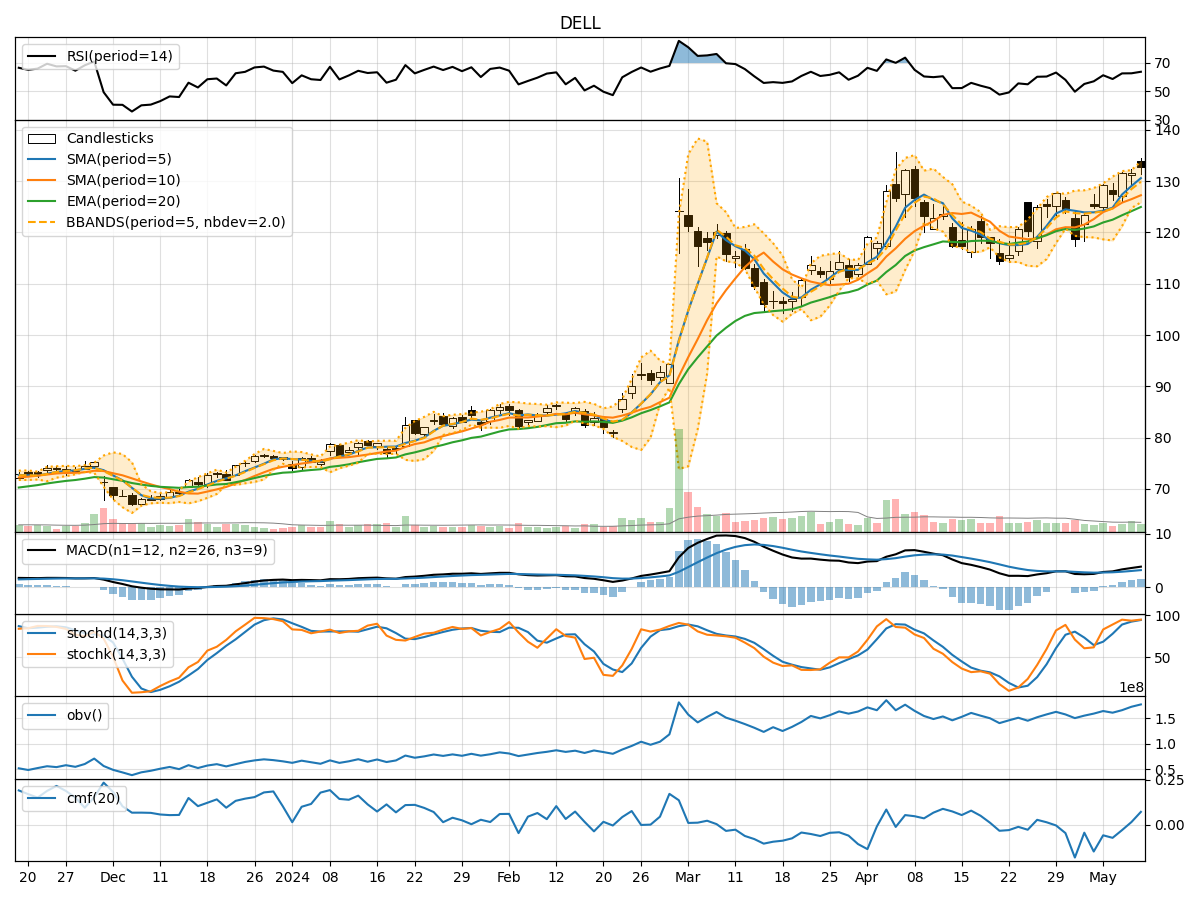
In the last 5 trading days, Dell's stock price has shown a generally positive trend, with an increase from $129.33 to $132.77. Various technical indicators have been analyzed to provide insights into the possible future movement of Dell's stock price.
Trend Indicators Analysis:
- Moving Averages (MA): The 5-day Moving Average has been consistently above the 10-day Simple Moving Average, indicating a short-term bullish trend.
- Exponential Moving Average (EMA): The EMA has been steadily increasing, reflecting a positive momentum in the stock price.
- Moving Average Convergence Divergence (MACD): The MACD line has been above the signal line, suggesting a bullish signal.
Key Observation: The trend indicators point towards a bullish outlook for Dell's stock price.
Momentum Indicators Analysis:
- Relative Strength Index (RSI): RSI has been in the range of 60-70, indicating a balanced momentum without being overbought or oversold.
- Stochastic Oscillator: Both %K and %D have been in the overbought territory, suggesting a potential reversal.
- Williams %R (Willams %R): The indicator has been hovering around -10, indicating a possible overbought condition.
Key Observation: Momentum indicators suggest a cautious view due to potential overbought signals.
Volatility Indicators Analysis:
- Bollinger Bands (BB): The stock price has been trading within the upper Bollinger Band, indicating an overbought condition.
- Bollinger Band Width (BBW): The Band Width has been narrowing, suggesting a decrease in volatility.
- Bollinger Band %B (BBP): %B has been above 0.5, indicating an overbought condition.
Key Observation: Volatility indicators signal a potential consolidation or reversal due to the overbought condition.
Volume Indicators Analysis:
- On-Balance Volume (OBV): The OBV has shown a positive trend, indicating accumulation of the stock.
- Chaikin Money Flow (CMF): The CMF has been negative, suggesting a bearish money flow.
Key Observation: Volume indicators provide a mixed signal with accumulation but bearish money flow.
Conclusion:
Based on the analysis of trend, momentum, volatility, and volume indicators, the next few days' possible stock price movement for Dell is likely to be sideways or consolidation with a cautious outlook. While trend indicators suggest a bullish trend, momentum and volatility indicators signal a potential reversal or consolidation. Volume indicators also provide a mixed signal, indicating uncertainty in the market sentiment.
Overall View: The stock price of Dell is likely to experience a period of consolidation or sideways movement in the next few days, with a potential for a reversal in the short term. Traders should exercise caution and closely monitor key support and resistance levels for potential entry or exit points.