Technical Analysis of DIS 2024-05-10
Overview:
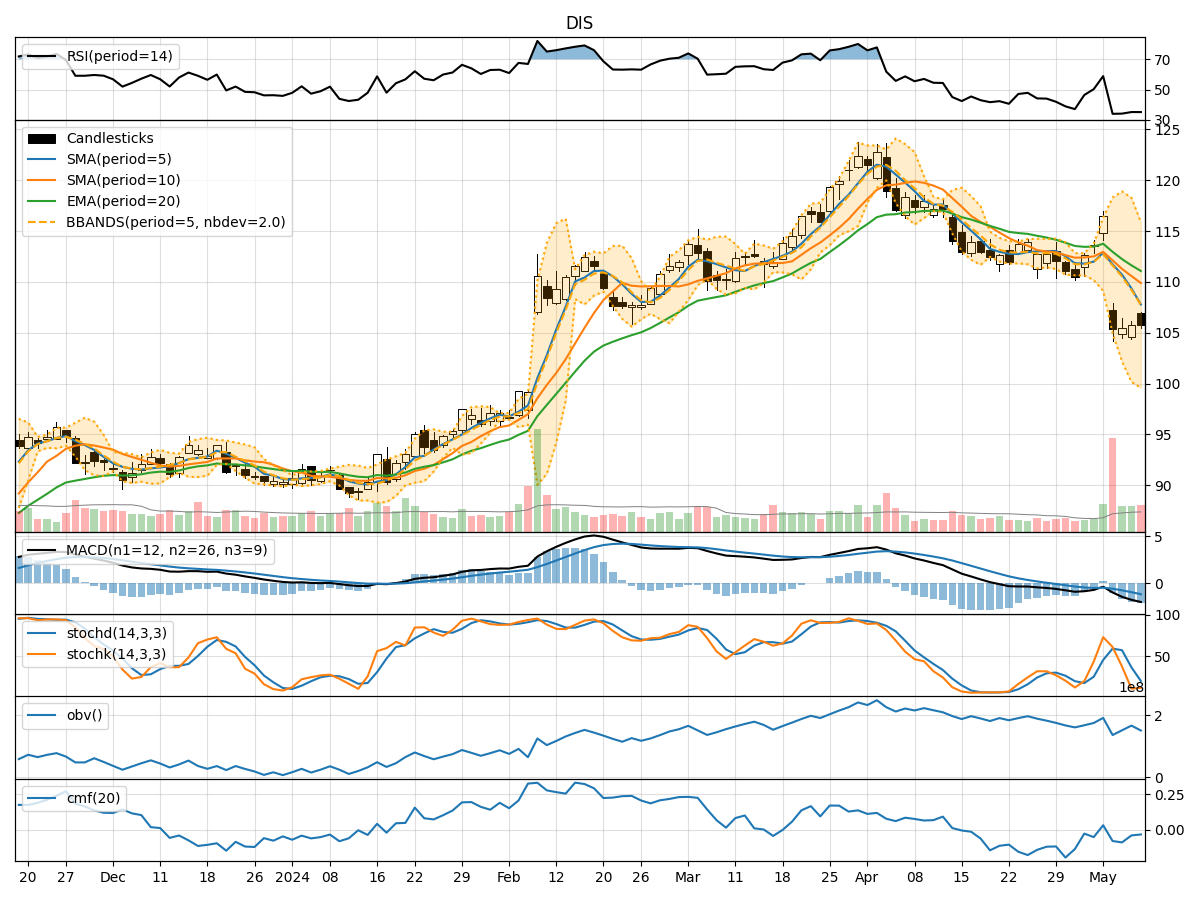
In analyzing the technical indicators for Disney (DIS) stock over the last 5 days, we will delve into the trend, momentum, volatility, and volume indicators to provide a comprehensive outlook on the possible future stock price movement. By examining these key indicators, we aim to offer valuable insights and predictions for the upcoming trading days.
Trend Analysis:
- Moving Averages (MA): The 5-day Moving Average (MA) has been consistently declining, indicating a bearish trend in the short term.
- MACD (Moving Average Convergence Divergence): The MACD and Signal line have been in negative territory, suggesting a bearish momentum.
- EMA (Exponential Moving Average): The EMA has also been trending downwards, reinforcing the bearish sentiment in the stock.
Momentum Analysis:
- RSI (Relative Strength Index): The RSI has been decreasing and is currently below 50, indicating a weakening momentum.
- Stochastic Oscillator: Both %K and %D lines of the Stochastic Oscillator are in oversold territory, signaling a potential reversal or bounce.
- Williams %R (Willams Percentage Range): The Williams %R is deeply oversold, suggesting a possible bullish reversal in the near future.
Volatility Analysis:
- Bollinger Bands (BB): The stock price has been trading below the lower Bollinger Band, indicating oversold conditions and a potential reversal.
- Bollinger Band Width (BBW): The Bollinger Band Width has widened, suggesting increased volatility in the stock.
- Bollinger Band %B (BBP): The %B is below 0.2, indicating an oversold condition and a possible bounce in the stock price.
Volume Analysis:
- On-Balance Volume (OBV): The OBV has been declining, indicating selling pressure in the stock.
- Chaikin Money Flow (CMF): The CMF has been negative, suggesting outflow of money from the stock.
Key Observations:
- The technical indicators collectively point towards a bearish sentiment in the stock.
- The stock is currently oversold based on various indicators like Williams %R and Bollinger Bands, indicating a potential reversal or bounce.
- The momentum indicators show signs of weakness but also hint at a possible bullish reversal in the near future.
Conclusion:
Based on the analysis of the technical indicators, the next few days' possible stock price movement for Disney (DIS) is likely to see a short-term bounce or reversal. The stock is currently oversold, and with indicators like Williams %R and Stochastic Oscillator signaling potential bullish reversals, there is a possibility of a temporary upward movement in the stock price. However, the overall trend remains bearish, so any upside is expected to be limited. Traders should exercise caution and consider implementing risk management strategies in their trading decisions.