Technical Analysis of EBR 2024-05-10
Overview:
In analyzing the technical indicators for EBR over the last 5 days, we will delve into the trend, momentum, volatility, and volume indicators to provide a comprehensive outlook on the possible stock price movement in the coming days. By examining these key aspects, we aim to offer valuable insights and predictions for informed decision-making.
Trend Analysis:
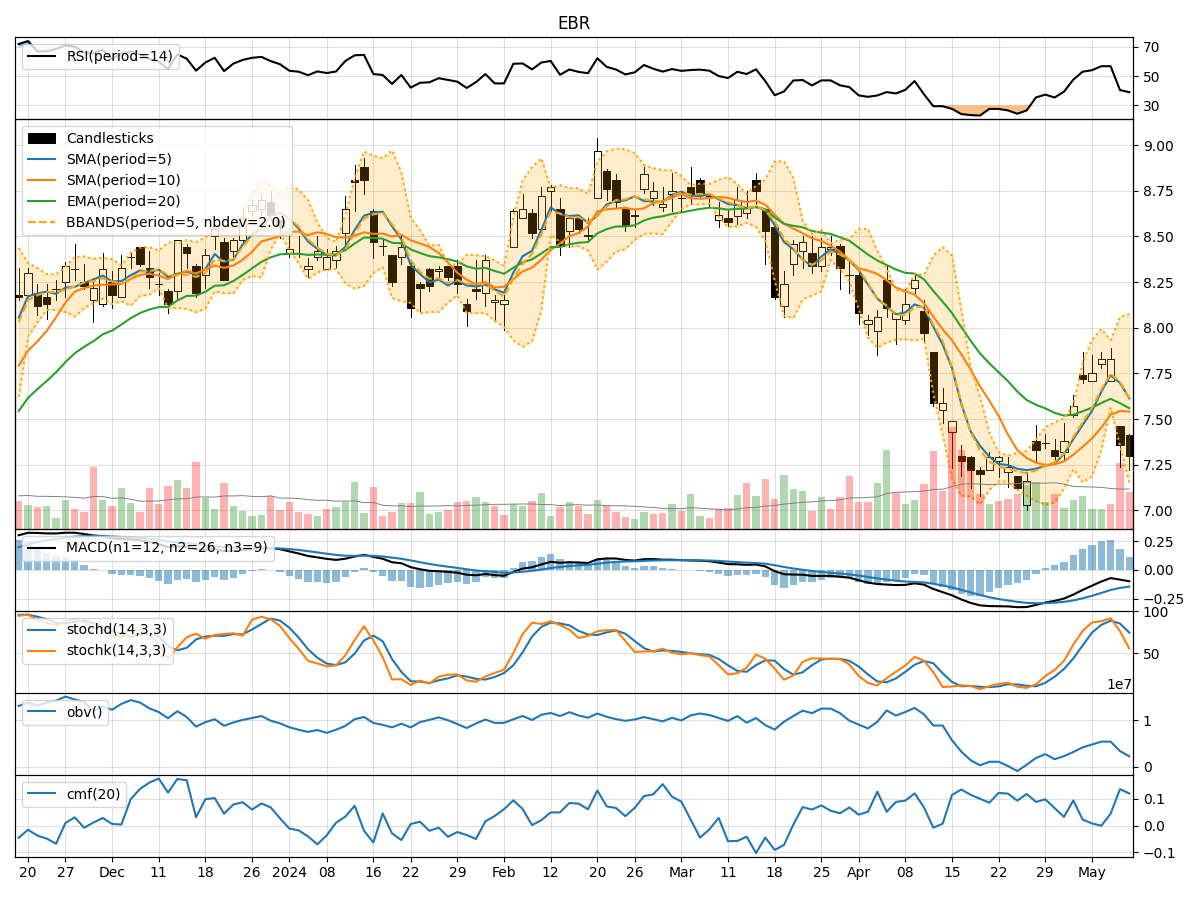
- Moving Averages (MA): The 5-day Moving Average (MA) has been fluctuating around the closing prices, indicating short-term price trends. The Simple Moving Average (SMA) and Exponential Moving Average (EMA) show a slight upward trend, suggesting potential bullish momentum.
- Moving Average Convergence Divergence (MACD): The MACD line has been negative but showing signs of convergence towards the signal line, indicating a possible trend reversal.
- Conclusion: The trend indicators suggest a potential bullish reversal in the short term.
Momentum Analysis:
- Relative Strength Index (RSI): The RSI values have been moderate, indicating neither overbought nor oversold conditions.
- Stochastic Oscillator: Both %K and %D values have been fluctuating, with recent declines, suggesting a weakening momentum.
- Conclusion: The momentum indicators imply a neutral to slightly bearish sentiment in the near future.
Volatility Analysis:
- Bollinger Bands (BB): The Bollinger Bands have shown narrowing volatility, with the price approaching the lower band, indicating a potential price reversal.
- Conclusion: The volatility indicators point towards a possible price reversal or consolidation in the upcoming sessions.
Volume Analysis:
- On-Balance Volume (OBV): The OBV has been negative, indicating more selling pressure in recent trading sessions.
- Chaikin Money Flow (CMF): The CMF has shown a slight increase, suggesting some buying interest.
- Conclusion: The volume indicators reflect a mixed sentiment with selling pressure but a slight increase in buying interest.
Overall Conclusion:
Based on the analysis of trend, momentum, volatility, and volume indicators, the overall outlook for EBR in the next few days leans towards a potential bullish reversal in the short term. While momentum and volume indicators show some weakness and mixed signals, the trend indicators point towards a positive price movement. Traders and investors should closely monitor the price action for confirmation of the bullish reversal and consider risk management strategies in their trading decisions.
Key Takeaways:
- Trend: Upward bias, indicating a potential bullish reversal.
- Momentum: Neutral to slightly bearish sentiment.
- Volatility: Expectation of a price reversal or consolidation.
- Volume: Mixed signals with selling pressure but some buying interest.
In conclusion, while no analysis can guarantee future price movements, the technical indicators suggest a cautiously optimistic outlook for EBR in the coming days. It is essential to combine technical analysis with fundamental research and risk management strategies for well-informed trading decisions.