Technical Analysis of EDU 2024-05-10
Overview:
In analyzing the technical indicators for EDU over the last 5 days, we will delve into the trend, momentum, volatility, and volume indicators to provide a comprehensive outlook on the possible stock price movement. By examining these key aspects, we aim to offer valuable insights and predictions for the upcoming days.
Trend Analysis:
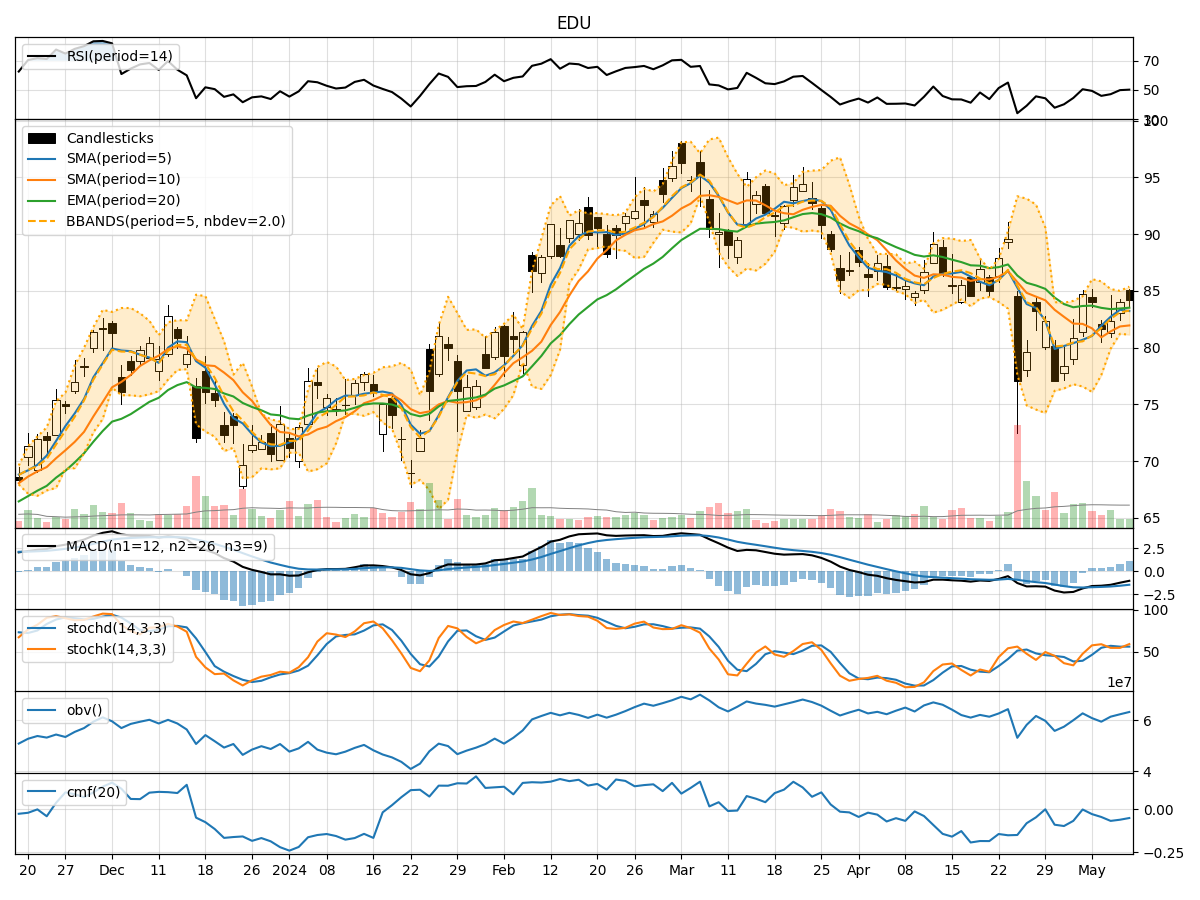
- Moving Averages (MA): The 5-day Moving Average (MA) has been fluctuating around the closing prices, indicating short-term price trends. The Simple Moving Average (SMA) and Exponential Moving Average (EMA) show a slight convergence, suggesting a potential reversal in the trend.
- Moving Average Convergence Divergence (MACD): The MACD and Signal Line have been in negative territory, but the MACD Histogram is showing signs of improvement, hinting at a possible bullish crossover in the near future.
Momentum Analysis:
- Relative Strength Index (RSI): The RSI has been hovering around the neutral zone, indicating a balanced momentum between buying and selling pressure.
- Stochastic Oscillator: Both %K and %D lines of the Stochastic Oscillator are in the mid-range, suggesting a lack of strong momentum in either direction.
- Williams %R (Willams %R): The Williams %R is also near the oversold region, indicating a potential buying opportunity.
Volatility Analysis:
- Bollinger Bands (BB): The Bollinger Bands have been narrowing, indicating decreasing volatility in the stock price. The bands are squeezing, which could lead to a breakout in either direction.
- Bollinger Band %B (BB %B): The %B indicator is above 0.5, suggesting a bullish sentiment in the market.
Volume Analysis:
- On-Balance Volume (OBV): The OBV has been relatively stable, indicating a balance between buying and selling pressure.
- Chaikin Money Flow (CMF): The CMF has been negative, reflecting a slight outflow of money from the stock.
Key Observations:
- The trend indicators show a potential reversal in the short-term trend.
- Momentum indicators suggest a lack of strong buying or selling pressure.
- Volatility is decreasing, indicating a period of consolidation.
- Volume indicators point towards a balanced market sentiment with a slight outflow of money.
Conclusion:
Based on the analysis of the technical indicators, the stock price of EDU is likely to experience sideways movement in the upcoming days. The convergence of moving averages, improving MACD histogram, and narrowing Bollinger Bands indicate a period of consolidation. The lack of strong momentum and balanced volume further support this view. Traders may consider adopting a wait-and-see approach until clearer signals emerge in the technical indicators.