Technical Analysis of ELPC 2024-05-10
Overview:
In analyzing the technical indicators for ELPC over the last 5 days, we will delve into the trend, momentum, volatility, and volume indicators to provide a comprehensive assessment of the stock's potential price movement. By examining these key factors, we aim to offer valuable insights and predictions for the next few days.
Trend Analysis:
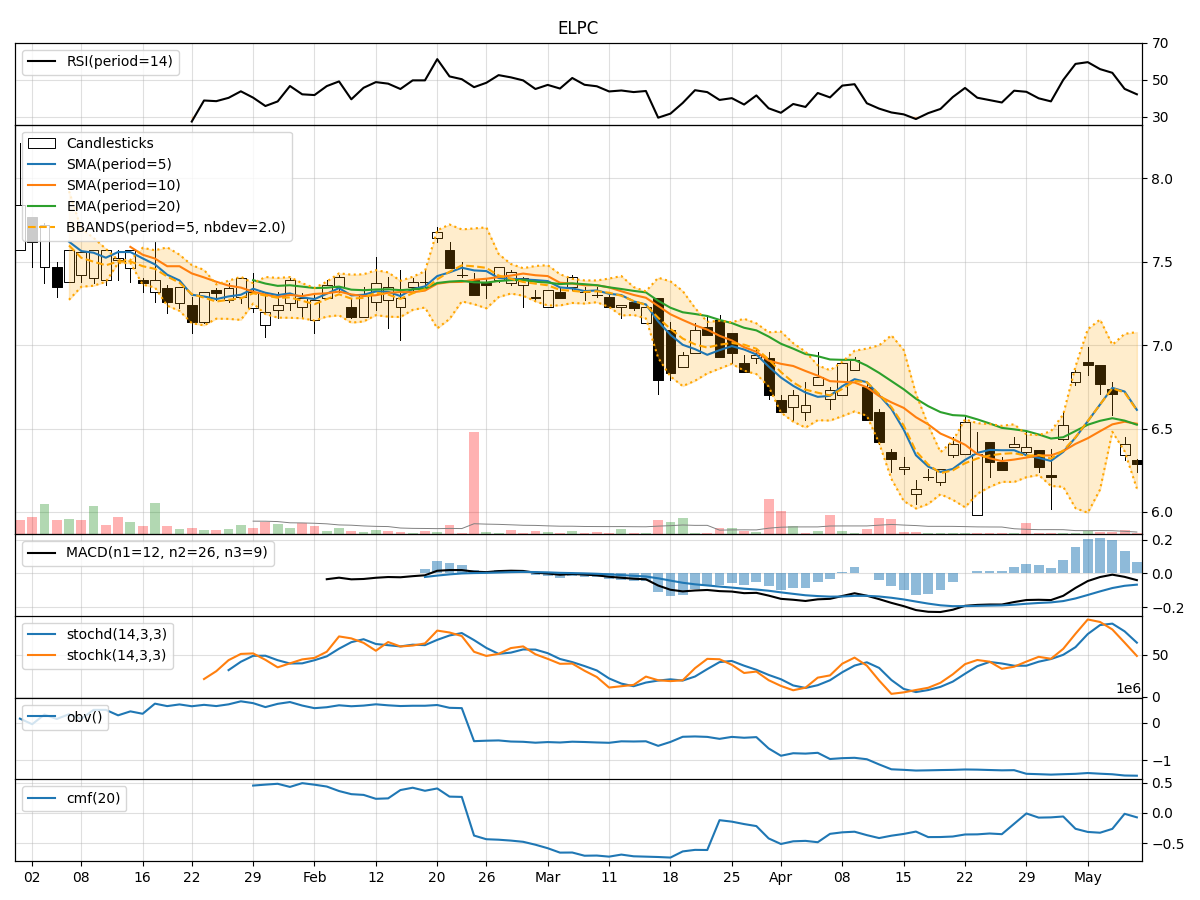
- Moving Averages (MA): The 5-day Moving Average (MA) has been fluctuating around the closing prices, indicating short-term price trends. The Simple Moving Average (SMA) and Exponential Moving Average (EMA) show a slight upward trend, albeit with some volatility.
- MACD: The Moving Average Convergence Divergence (MACD) has been negative, suggesting a bearish momentum in the stock price. The MACD Histogram (MACDH) has been positive but decreasing, indicating a potential reversal in the bearish trend.
Momentum Analysis:
- RSI: The Relative Strength Index (RSI) has been declining, moving towards the oversold territory, indicating weakening momentum.
- Stochastic Oscillator: Both %K and %D of the Stochastic Oscillator have been decreasing, signaling a bearish momentum in the stock.
- Williams %R: The Williams %R is in the oversold region, suggesting a potential reversal or consolidation phase.
Volatility Analysis:
- Bollinger Bands (BB): The Bollinger Bands have been narrowing, indicating decreasing volatility in the stock price. The bands are relatively close to each other, suggesting a potential breakout or significant price movement.
- Bollinger %B: The Bollinger %B is hovering around 0.5, indicating a neutral position in terms of volatility.
Volume Analysis:
- On-Balance Volume (OBV): The OBV has been declining, indicating selling pressure in the stock. The decreasing OBV suggests a bearish sentiment among investors.
- Chaikin Money Flow (CMF): The CMF has been negative, indicating that money is flowing out of the stock. This further supports the bearish outlook.
Conclusion:
Based on the analysis of the technical indicators, the stock of ELPC is currently in a bearish phase. The trend indicators show a potential reversal in the bearish trend, but the momentum and volume indicators suggest a continuation of the downward movement. The volatility is relatively low, indicating a possible consolidation phase before a significant price movement.
Forecast:
Considering the overall bearish sentiment and the technical indicators pointing towards a potential continuation of the downward trend, it is likely that ELPC's stock price will experience further decline in the next few days. Traders and investors should exercise caution and consider waiting for more definitive signals before making any buying decisions.