Technical Analysis of ELV 2024-05-10
Overview:
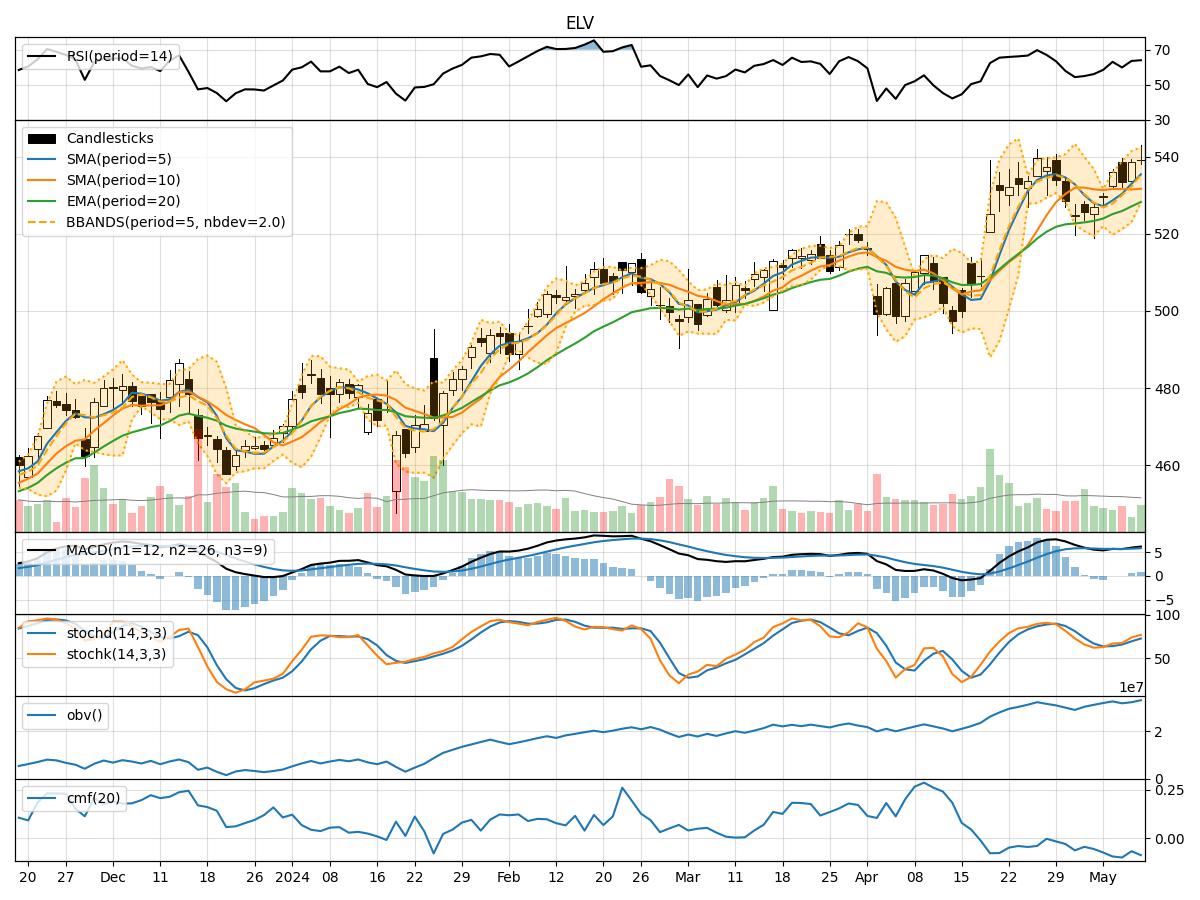
In analyzing the technical indicators for ELV stock over the last 5 days, we will delve into the trends, momentum, volatility, and volume indicators to provide a comprehensive outlook on the possible stock price movement in the coming days. By examining key metrics such as moving averages, MACD, RSI, Bollinger Bands, and OBV, we aim to offer valuable insights and predictions for potential price action.
Trend Indicators:
- Moving Averages (MA): The 5-day MA has been trending upwards, indicating a positive short-term momentum in the stock price.
- MACD: The MACD line has been consistently above the signal line, suggesting a bullish trend in the stock.
- EMA: The EMA has been steadily increasing, reflecting a positive price trend.
Momentum Indicators:
- RSI: The RSI has been in the neutral to slightly overbought territory, indicating potential strength in the stock price.
- Stochastic Oscillator: Both %K and %D have been rising, signaling increasing buying pressure.
- Williams %R: The indicator has been hovering around oversold levels, suggesting a possible reversal in the stock price.
Volatility Indicators:
- Bollinger Bands: The stock price has been trading within the bands, indicating a period of consolidation.
- Bollinger %B: The %B value has been fluctuating within a narrow range, suggesting a lack of significant volatility.
Volume Indicators:
- On-Balance Volume (OBV): The OBV has shown mixed signals, with no clear trend in volume accumulation or distribution.
- Chaikin Money Flow (CMF): The CMF has been negative, indicating potential selling pressure in the stock.
Key Observations:
- The stock is currently in an upward trend based on moving averages and MACD.
- Momentum indicators suggest bullish sentiment with RSI in the overbought zone.
- Volatility indicators point towards a consolidation phase with limited price movement.
- Volume indicators show mixed signals with no clear accumulation or distribution pattern.
Conclusion:
Based on the analysis of technical indicators, the next few days for ELV stock are likely to see continued upward movement with a bullish bias. The positive trend indicated by moving averages and MACD, coupled with momentum indicators showing strength, suggests that the stock price may experience further gains. However, the consolidation phase indicated by volatility indicators and mixed volume signals warrant caution. Traders and investors should closely monitor key levels and market developments to capitalize on potential opportunities while managing risks effectively.