Technical Analysis of FUN 2024-05-31
Overview:
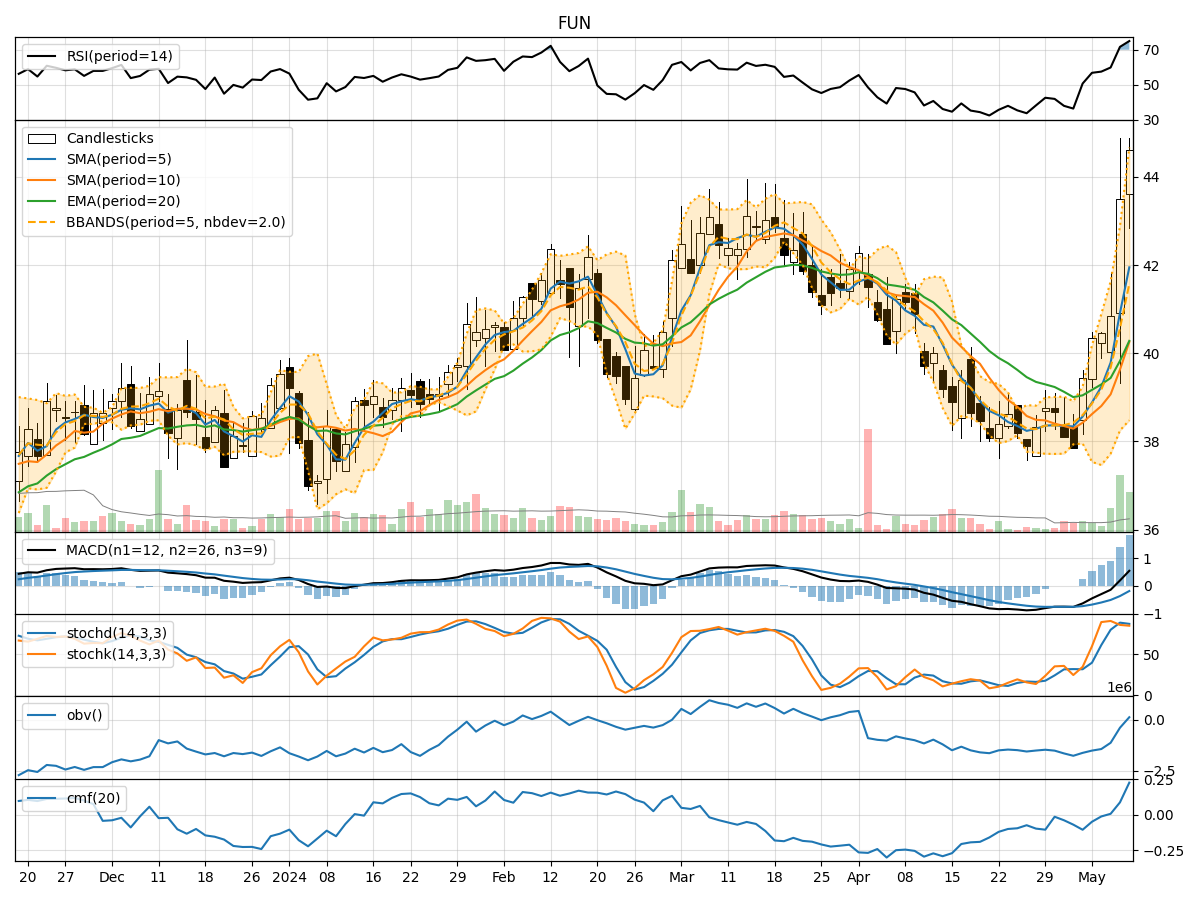
In analyzing the technical indicators for the stock FUN over the last 5 days, we will delve into the trends, momentum, volatility, and volume indicators to provide a comprehensive outlook on the possible stock price movement in the coming days. By examining key metrics such as moving averages, MACD, RSI, Bollinger Bands, and OBV, we aim to offer valuable insights and predictions for potential price action.
Trend Indicators:
- Moving Averages (MA): The 5-day MA has been fluctuating around the closing prices, indicating short-term price trends. The SMA(10) and EMA(20) show a slight decline, suggesting a weakening trend.
- MACD: The MACD line has been decreasing, with the MACD histogram showing a negative trend. This indicates a bearish momentum in the stock.
- Conclusion: The trend indicators point towards a downward trend in the stock price.
Momentum Indicators:
- RSI: The RSI has been declining, indicating a decrease in buying momentum and potential oversold conditions.
- Stochastic Oscillator: Both %K and %D have been decreasing, signaling a bearish momentum.
- Conclusion: Momentum indicators suggest a bearish sentiment in the stock.
Volatility Indicators:
- Bollinger Bands: The stock price has been trading within the bands, with the lower band acting as a support level.
- Bollinger %B: The %B is relatively low, indicating a potential oversold condition.
- Conclusion: Volatility indicators suggest a sideways movement with a slight bearish bias.
Volume Indicators:
- On-Balance Volume (OBV): The OBV has been fluctuating, indicating a balance between buying and selling pressure.
- Chaikin Money Flow (CMF): The CMF is positive, suggesting buying pressure in the stock.
- Conclusion: Volume indicators show a neutral stance with a slight bullish bias.
Overall Conclusion:
Based on the analysis of trend, momentum, volatility, and volume indicators, the stock FUN is likely to experience a downward trend in the coming days. The bearish signals from trend and momentum indicators outweigh the neutral to slightly bullish signals from volatility and volume indicators. Traders and investors should exercise caution and consider potential short-selling opportunities or wait for a clearer bullish reversal signal before considering long positions.