Technical Analysis of GE 2024-05-10
Overview:
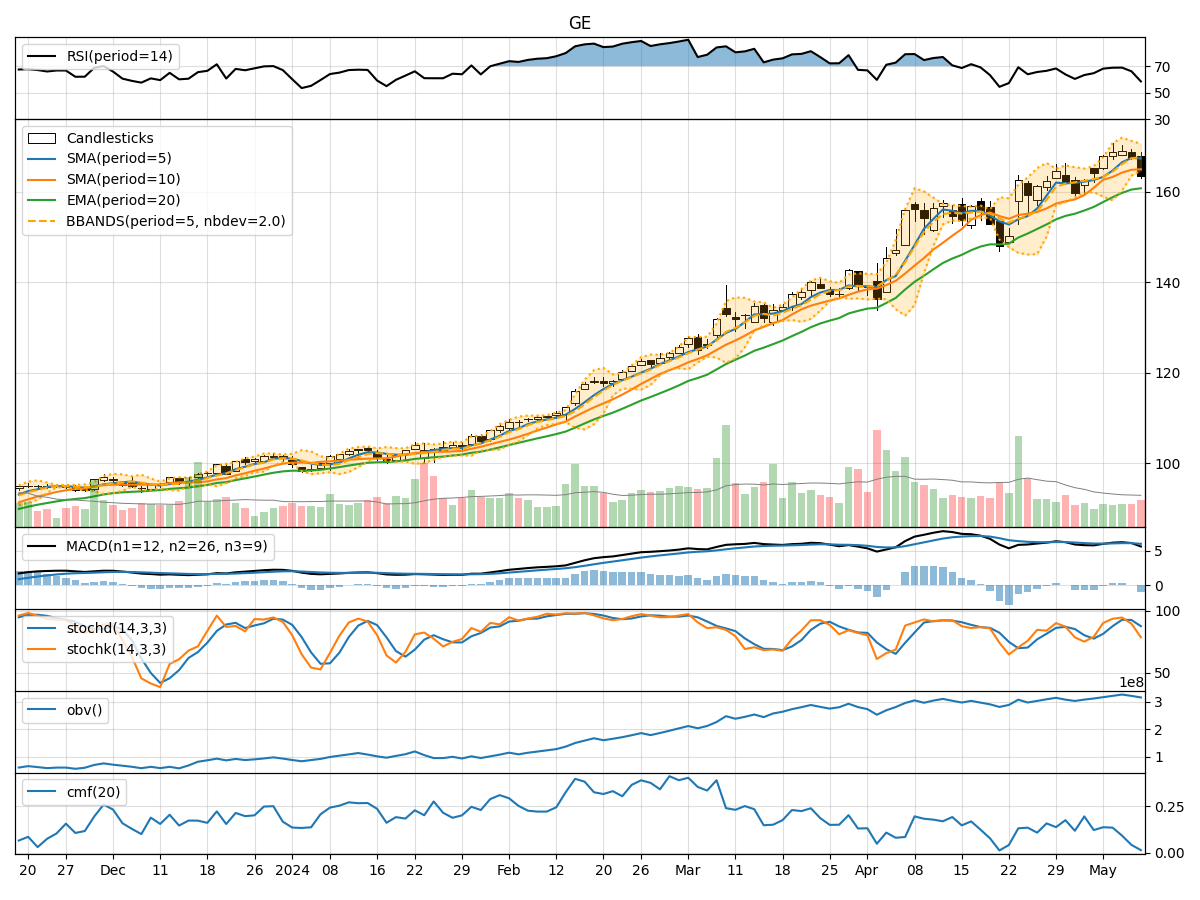
In analyzing the technical indicators for GE over the last 5 days, we will delve into the trend, momentum, volatility, and volume indicators to provide a comprehensive outlook on the possible stock price movement in the coming days.
Trend Analysis:
- Moving Averages (MA): The 5-day Moving Average (MA) has been consistently above the Simple Moving Average (SMA) and Exponential Moving Average (EMA), indicating a bullish trend.
- MACD: The MACD line has been fluctuating around the signal line, suggesting a potential reversal or consolidation phase.
- RSI: The Relative Strength Index (RSI) has been declining, indicating a weakening momentum.
Momentum Analysis:
- Stochastic Oscillator: Both %K and %D have been decreasing, signaling a potential bearish momentum.
- Williams %R: The Williams %R is in oversold territory, indicating a possible reversal or bounce.
Volatility Analysis:
- Bollinger Bands (BB): The stock price has been trading within the Bollinger Bands, with the bands narrowing, suggesting reduced volatility.
- Bollinger %B: The %B indicator is close to 0, indicating the stock is trading near the lower band.
Volume Analysis:
- On-Balance Volume (OBV): The OBV has been declining, suggesting selling pressure in the stock.
- Chaikin Money Flow (CMF): The CMF has been decreasing, indicating a decrease in buying pressure.
Key Observations:
- The trend indicators suggest a bullish bias, but the MACD and RSI indicate a potential reversal or consolidation.
- Momentum indicators show a weakening momentum with stochastic indicators pointing towards a bearish sentiment.
- Volatility indicators signal reduced volatility and a possible consolidation phase.
- Volume indicators reflect selling pressure and a decrease in buying interest.
Conclusion:
Based on the analysis of the technical indicators, the next few days for GE stock are likely to see a downward movement. The weakening momentum, bearish signals from the stochastic oscillator, and declining volume indicators all point towards a potential bearish trend. Traders and investors should exercise caution and consider implementing risk management strategies in anticipation of a downward price movement.