Technical Analysis of GME 2024-05-10
Overview:
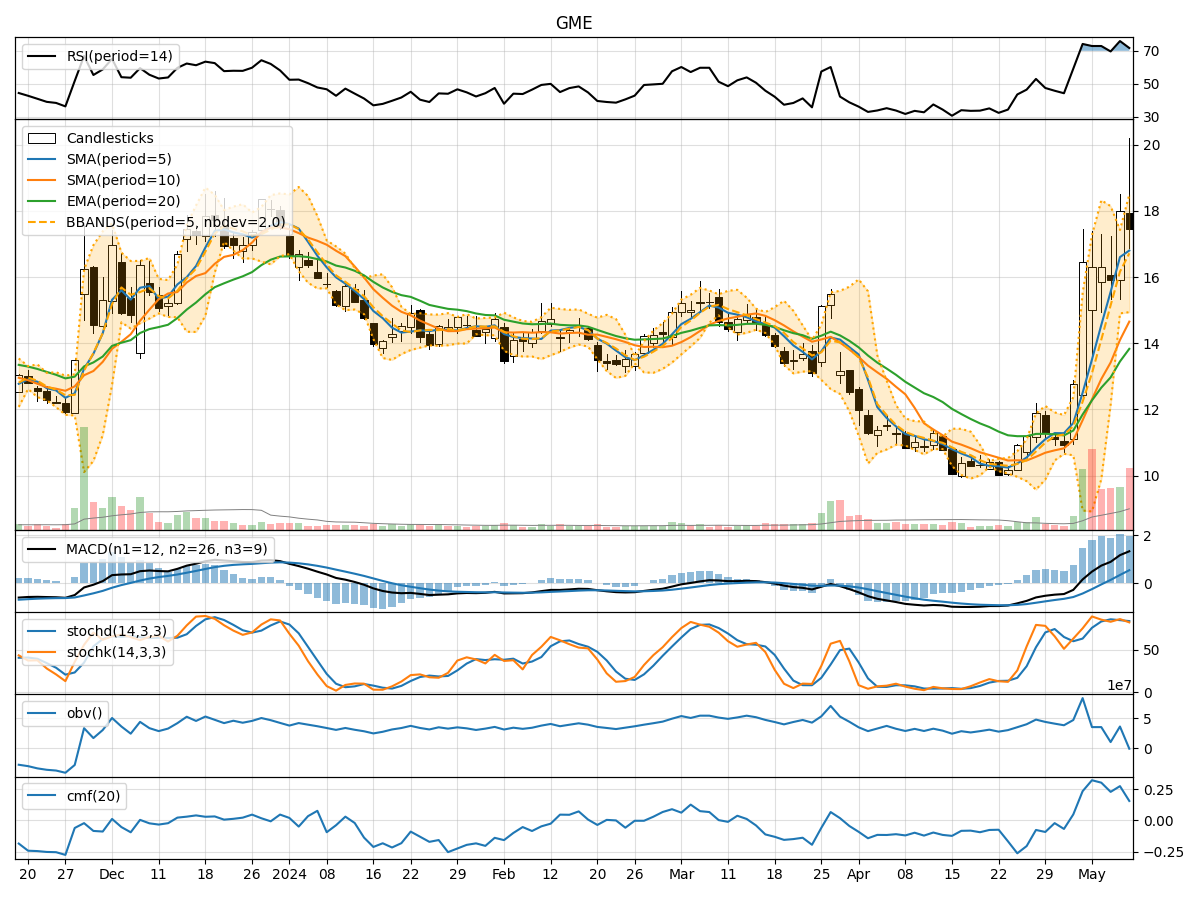
In analyzing the technical indicators for GME over the last 5 days, we will delve into the trend, momentum, volatility, and volume indicators to provide a comprehensive outlook on the possible stock price movement. By examining these key aspects, we aim to offer valuable insights and predictions for the upcoming days.
Trend Analysis:
- Moving Averages (MA): The 5-day Moving Average (MA) has been consistently rising, indicating a bullish trend in the short term.
- MACD: The MACD line has been above the signal line, suggesting positive momentum in the stock price.
- EMA: The Exponential Moving Average (EMA) has been trending upwards, supporting the bullish sentiment.
Momentum Analysis:
- RSI: The Relative Strength Index (RSI) has been fluctuating but generally staying within the neutral to overbought range, indicating mixed momentum.
- Stochastic Oscillator: Both %K and %D have been fluctuating, showing indecision in momentum.
- Williams %R: The Williams %R has been in the oversold territory, suggesting a potential reversal in momentum.
Volatility Analysis:
- Bollinger Bands: The Bollinger Bands have been widening, indicating increased volatility in the stock price.
- Bollinger %B: The %B indicator has been fluctuating within the bands, reflecting the volatility in price movements.
Volume Analysis:
- On-Balance Volume (OBV): The OBV has shown mixed signals, with alternating positive and negative values, indicating uncertainty in volume trends.
- Chaikin Money Flow (CMF): The CMF has been fluctuating around the zero line, suggesting a balance between buying and selling pressure.
Key Observations:
- The trend indicators suggest a bullish sentiment in the short term.
- Momentum indicators show mixed signals, with some pointing towards a potential reversal.
- Volatility has increased, indicating potential price swings.
- Volume indicators reflect uncertainty in volume trends.
Conclusion:
Based on the analysis of the technical indicators, the next few days' possible stock price movement for GME could be upward with increased volatility. While the trend indicators support a bullish view, the mixed signals from momentum indicators and uncertainty in volume trends suggest caution. Traders should closely monitor price movements and key support/resistance levels for potential entry or exit points.