Technical Analysis of HIPO 2024-05-31
Overview:
In analyzing the provided HIPO TA data for the last 5 days, we will delve into the technical indicators across trend, momentum, volatility, and volume to derive insights into the possible future stock price movement. By examining these indicators comprehensively, we aim to provide a well-informed prediction backed by data-driven analysis and expert interpretation.
Trend Analysis:
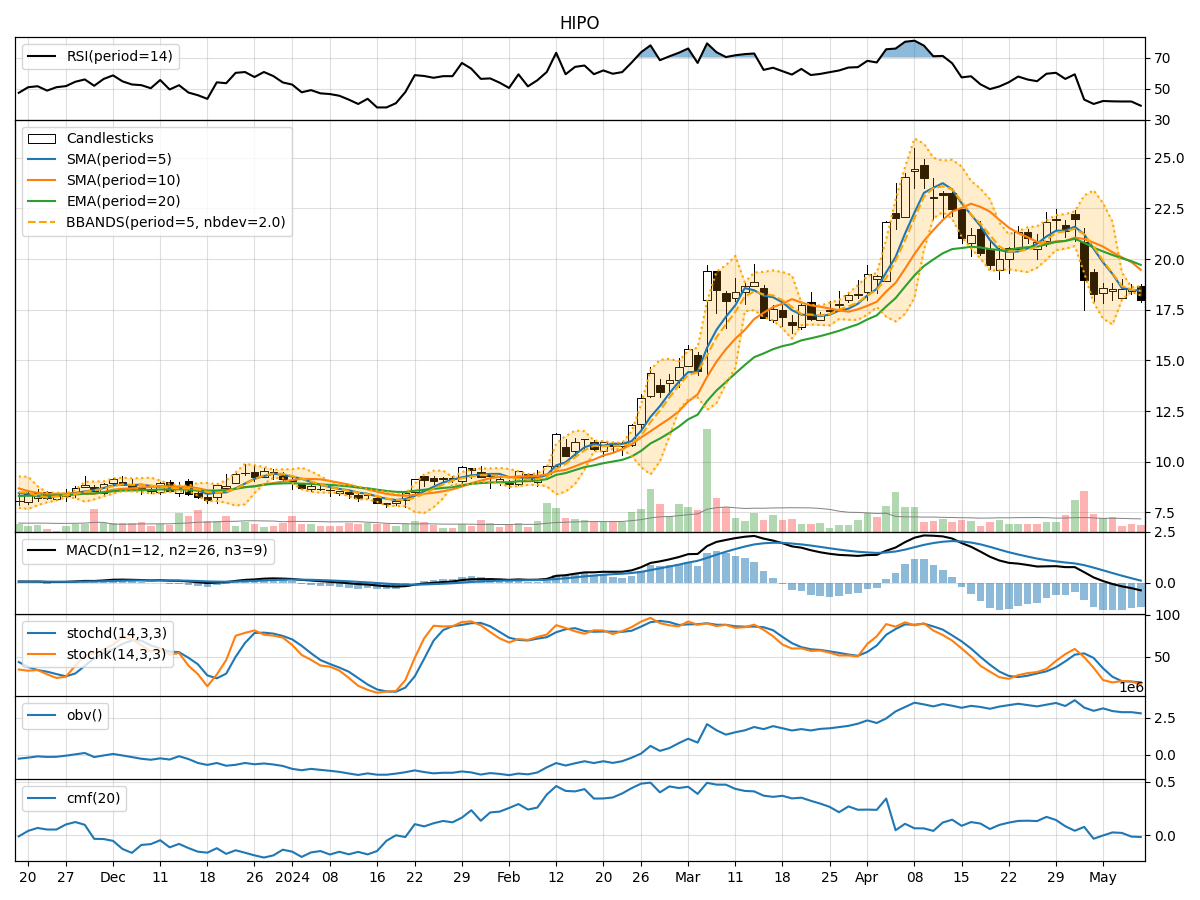
- Moving Averages (MA): The 5-day MA has been fluctuating around the closing prices, indicating short-term price trends. The SMA(10) and EMA(20) show a slight downward trend, suggesting a potential bearish sentiment.
- MACD and Signal Line: The MACD has been negative, with the MACD line consistently below the signal line, indicating a bearish trend in the short term.
Momentum Analysis:
- RSI: The RSI values have been relatively neutral, hovering around the mid-range, indicating a lack of strong momentum in either direction.
- Stochastic Oscillator: The stochastic indicators have shown fluctuations but are not in extreme overbought or oversold territory, suggesting a balanced momentum.
Volatility Analysis:
- Bollinger Bands (BB): The bands have been narrowing, indicating decreasing volatility in the stock price. The bands are relatively close to each other, suggesting a period of consolidation.
- Bollinger Percent (BBP): The BBP values have been low, indicating that the stock price is currently trading near the lower band, potentially signaling a buying opportunity.
Volume Analysis:
- On-Balance Volume (OBV): The OBV has shown a slight decline over the past few days, indicating some selling pressure in the stock.
- Chaikin Money Flow (CMF): The CMF has been negative, suggesting that money may be flowing out of the stock in the short term.
Key Observations and Opinions:
- Trend: The trend indicators point towards a bearish sentiment in the short term, with moving averages and MACD signaling a potential downward movement.
- Momentum: The momentum indicators suggest a lack of strong momentum in either direction, indicating a period of consolidation or sideways movement.
- Volatility: The narrowing Bollinger Bands and low BBP values indicate decreased volatility and a potential consolidation phase.
- Volume: The declining OBV and negative CMF suggest some selling pressure and a bearish outlook in the short term.
Conclusion:
Based on the analysis of the technical indicators across trend, momentum, volatility, and volume, the outlook for the next few days is bearish. The trend indicators, coupled with the momentum and volume analysis, suggest a potential downward movement in the stock price. The narrowing Bollinger Bands and negative CMF further support this bearish view. Traders and investors should exercise caution and consider short-term selling or adopting a wait-and-see approach until a clearer trend emerges.