Technical Analysis of IBM 2024-05-10
Overview:
In analyzing the technical indicators for IBM over the last 5 days, we will delve into the trend, momentum, volatility, and volume indicators to provide a comprehensive outlook on the possible stock price movement in the coming days. By examining these key aspects, we aim to offer valuable insights and predictions to guide your investment decisions.
Trend Analysis:
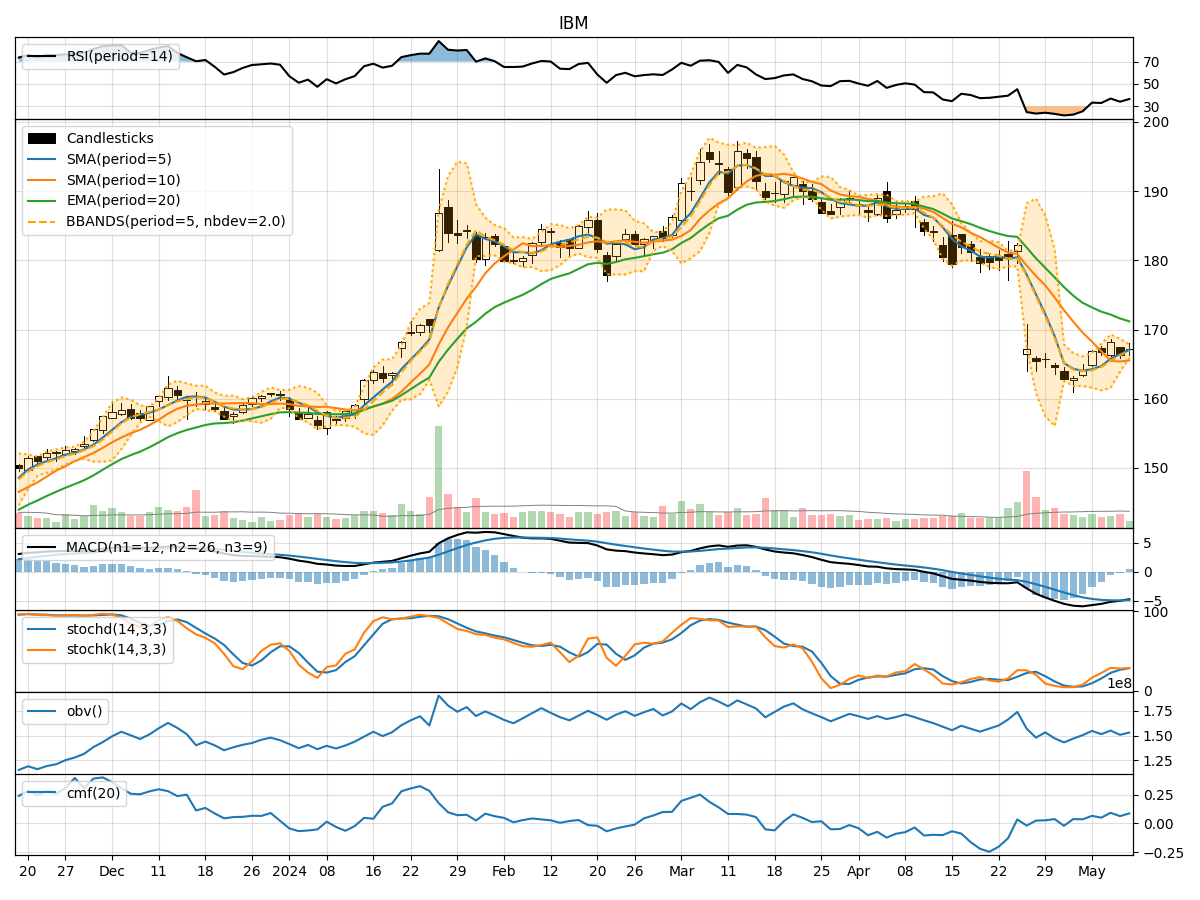
- Moving Averages (MA): The 5-day Moving Average (MA) has been showing an upward trend, indicating a positive momentum in the short term.
- MACD: The Moving Average Convergence Divergence (MACD) has been decreasing but remains negative, suggesting a potential reversal or consolidation phase.
Momentum Analysis:
- RSI: The Relative Strength Index (RSI) has been fluctuating around the oversold region, indicating a lack of strong momentum.
- Stochastic Oscillator: Both %K and %D of the Stochastic Oscillator are in the neutral zone, reflecting a balanced momentum.
Volatility Analysis:
- Bollinger Bands (BB): The Bollinger Bands are narrowing, suggesting a decrease in volatility and a possible period of consolidation.
Volume Analysis:
- On-Balance Volume (OBV): The OBV has been fluctuating, indicating indecision among investors regarding the stock.
- Chaikin Money Flow (CMF): The CMF is positive, signaling potential buying pressure in the market.
Key Observations:
- The trend indicators show a mixed signal with a slight bullish bias in the short term.
- Momentum indicators suggest a lack of strong momentum either bullish or bearish.
- Volatility indicators point towards a potential period of consolidation or a decrease in price fluctuations.
- Volume indicators reflect indecision among investors but with a slight positive bias.
Conclusion:
Based on the analysis of the technical indicators, the next few days for IBM stock price movement are likely to be sideways or consolidation with a neutral bias. There is a lack of strong bullish or bearish signals, indicating a period of uncertainty and potential range-bound trading. Investors may consider staying cautious and monitoring the price action closely for any breakout or trend reversal signals before making significant trading decisions.