Technical Analysis of JKS 2024-05-10
Overview:
In analyzing the technical indicators for JKS over the last 5 days, we will delve into the trend, momentum, volatility, and volume indicators to provide a comprehensive outlook on the possible stock price movement. By examining these key factors, we aim to offer valuable insights and recommendations for potential future price action.
Trend Indicators:
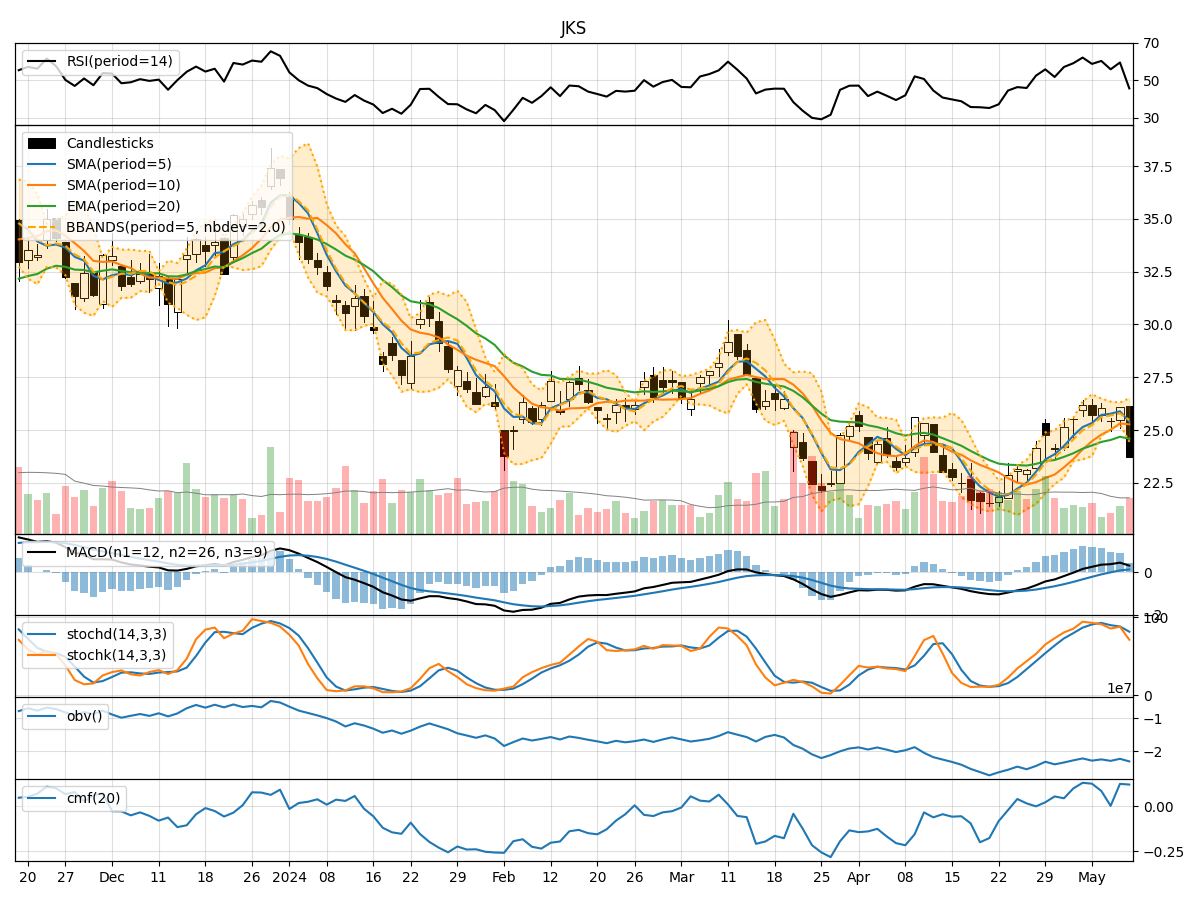
- Moving Averages (MA): The 5-day MA has been fluctuating around the closing prices, indicating short-term price trends. The SMA(10) and EMA(20) show a gradual increase over the period, suggesting a positive trend.
- MACD: The MACD line has been positive, indicating bullish momentum. The MACD Histogram has shown an increasing trend, further supporting the bullish sentiment.
Momentum Indicators:
- RSI: The RSI has been hovering around the neutral zone, indicating a balanced momentum in the stock.
- Stochastic Oscillator: Both %K and %D have been declining, suggesting a potential reversal in momentum.
- Williams %R: The indicator has been in oversold territory, signaling a possible buying opportunity.
Volatility Indicators:
- Bollinger Bands: The stock price has been trading within the bands, with the %B indicator showing a slight deviation from the upper band.
- Volatility: The volatility has been relatively stable, with no significant spikes or drops in the period.
Volume Indicators:
- On-Balance Volume (OBV): The OBV has been fluctuating, indicating mixed sentiment among investors.
- Chaikin Money Flow (CMF): The CMF has been positive, suggesting buying pressure in the stock.
Key Observations:
- The trend indicators point towards a positive outlook, with moving averages and MACD supporting a bullish sentiment.
- Momentum indicators show a mixed picture, with RSI neutral, Stochastic Oscillator indicating a potential reversal, and Williams %R signaling oversold conditions.
- Volatility has remained stable, indicating a lack of significant price fluctuations.
- Volume indicators suggest mixed sentiment among investors, with OBV fluctuating and CMF showing buying pressure.
Conclusion:
Based on the analysis of the technical indicators, the next few days' possible stock price movement for JKS is likely to be bullish. The trend indicators support a positive outlook, while momentum indicators show a mixed sentiment that may lead to a potential reversal in momentum. Volatility remains stable, indicating a controlled price movement, and volume indicators suggest a fluctuating sentiment among investors. Overall, considering the bullish trend and potential reversal in momentum, investors may expect an upward movement in the stock price in the coming days.