Technical Analysis of LAC 2024-05-10
Overview:
In analyzing the technical indicators for LAC over the last 5 days, we will delve into the trend, momentum, volatility, and volume indicators to provide a comprehensive outlook on the possible stock price movement in the coming days. By examining these key aspects, we aim to offer valuable insights and recommendations for potential investors.
Trend Analysis:
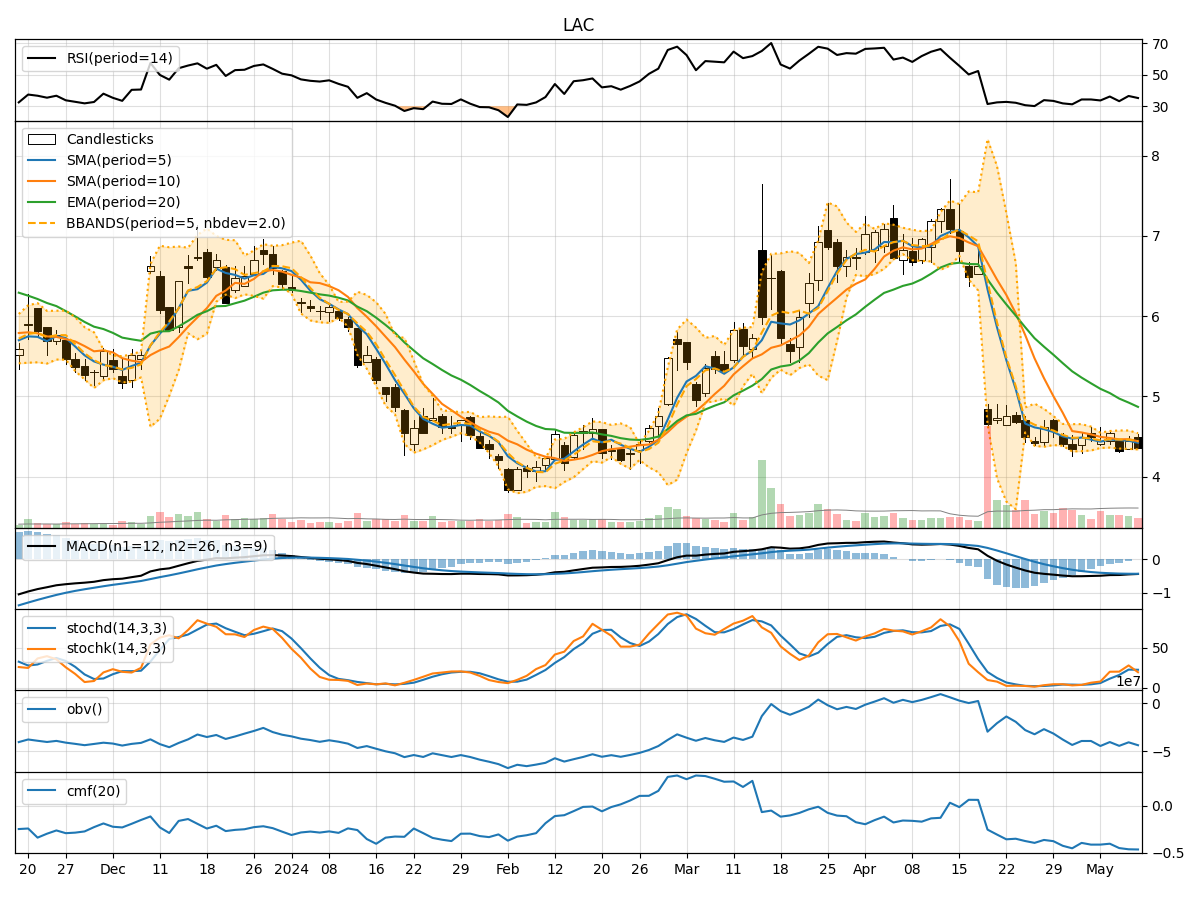
- Moving Averages (MA): The 5-day Moving Average (MA) has been fluctuating around the closing prices, indicating a lack of clear trend direction.
- MACD and Signal Line: The MACD has been consistently negative, suggesting a bearish momentum in the short term.
- Exponential Moving Average (EMA): The EMA has been declining, reflecting a downward trend in the stock price.
Momentum Analysis:
- Relative Strength Index (RSI): The RSI values have been hovering around the mid-range, indicating a neutral momentum with no extreme overbought or oversold conditions.
- Stochastic Oscillator: Both %K and %D values have been fluctuating, showing indecision in momentum.
- Williams %R (Willams %R): The Williams %R values have been consistently in oversold territory, suggesting a potential reversal in momentum.
Volatility Analysis:
- Bollinger Bands (BB): The Bollinger Bands have been narrowing, indicating decreasing volatility in the stock price.
- Bollinger Band %B (BB %B): The %B values have been fluctuating around the mid-range, reflecting a lack of clear direction in volatility.
Volume Analysis:
- On-Balance Volume (OBV): The OBV values have been fluctuating, indicating mixed buying and selling pressure.
- Chaikin Money Flow (CMF): The CMF values have been negative, suggesting a bearish money flow in the stock.
Key Observations and Opinions:
- Trend: The trend indicators point towards a bearish sentiment with declining moving averages and negative MACD values.
- Momentum: The momentum indicators suggest a neutral to slightly bearish momentum with RSI in the mid-range and stochastic oscillators showing indecision.
- Volatility: Volatility has been decreasing as indicated by the narrowing Bollinger Bands, signaling a period of consolidation.
- Volume: The volume indicators reflect mixed buying and selling pressure with a bearish money flow according to the CMF.
Conclusion:
Based on the analysis of the technical indicators, the outlook for LAC in the next few days is bearish. The trend indicators, momentum oscillators, and volume analysis all point towards a potential downward movement in the stock price. Investors should exercise caution and consider waiting for more definitive signals before making any trading decisions.