Technical Analysis of LND 2024-05-10
Overview:
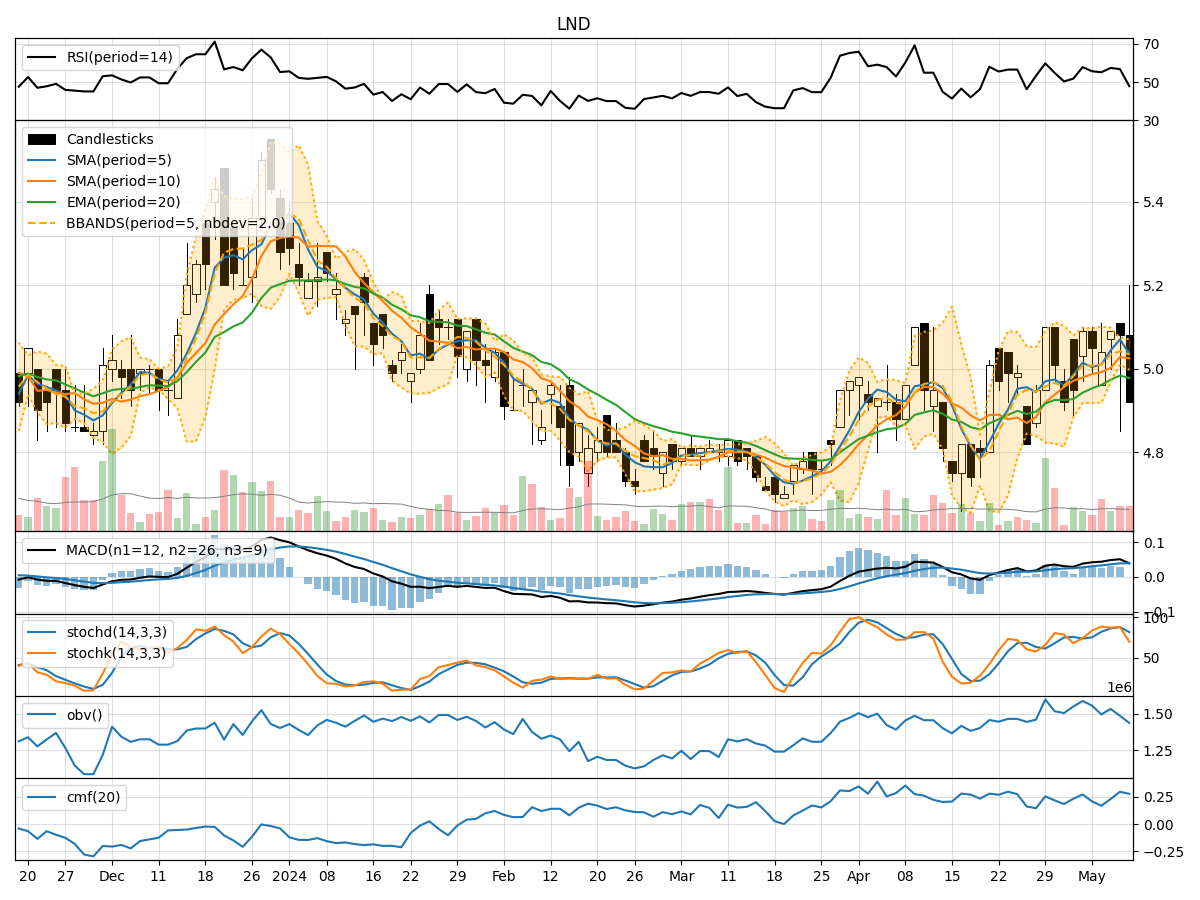
In analyzing the technical indicators for LND stock over the last 5 days, we will delve into the trend, momentum, volatility, and volume indicators to provide a comprehensive outlook on the possible stock price movement in the coming days.
Trend Analysis:
- Moving Averages (MA): The 5-day Moving Average (MA) has been fluctuating around the closing prices, indicating short-term price trends. The Simple Moving Average (SMA) and Exponential Moving Average (EMA) have shown an overall uptrend, suggesting a positive momentum.
- Moving Average Convergence Divergence (MACD): The MACD and Signal Line have been positive, with the MACD Histogram showing slight fluctuations but overall staying above the zero line. This indicates a bullish trend in the stock price.
Momentum Analysis:
- Relative Strength Index (RSI): The RSI has been oscillating around the 50 level, indicating a neutral momentum in the stock. There is no extreme overbought or oversold conditions.
- Stochastic Oscillator: Both %K and %D lines of the Stochastic Oscillator have been in the overbought zone, suggesting a potential reversal or consolidation in the stock price.
- Williams %R (Willams %R): The Williams %R has been in the oversold territory, indicating a bearish sentiment in the market.
Volatility Analysis:
- Bollinger Bands (BB): The Bollinger Bands have shown widening and narrowing patterns, indicating fluctuations in volatility. The current price is near the lower band, suggesting a possible reversal or bounce.
- Bollinger %B (BB %B): The %B indicator is close to 0, indicating a potential oversold condition in the stock.
Volume Analysis:
- On-Balance Volume (OBV): The OBV has shown mixed signals, with some days seeing positive volume accumulation and others showing distribution. This indicates indecision among market participants.
- Chaikin Money Flow (CMF): The CMF has been positive, suggesting buying pressure in the stock. However, the magnitude of the CMF is not significant, indicating moderate buying interest.
Conclusion:
Based on the analysis of the technical indicators, the stock of LND is currently in a sideways consolidation phase with a slight bullish bias. The moving averages and MACD signal a positive trend, while momentum indicators like the Stochastic Oscillator and Williams %R suggest a short-term bearish sentiment. Volatility is fluctuating, indicating potential price swings, and volume indicators show mixed signals.
Considering the overall picture, it is likely that the stock price of LND may experience further consolidation in the near term with potential for a slight upward movement. Traders should closely monitor key support and resistance levels, as a breakout in either direction could signal a new trend. It is advisable to wait for more confirmation from the indicators before making significant trading decisions.