Technical Analysis of MEG 2024-05-10
Overview:
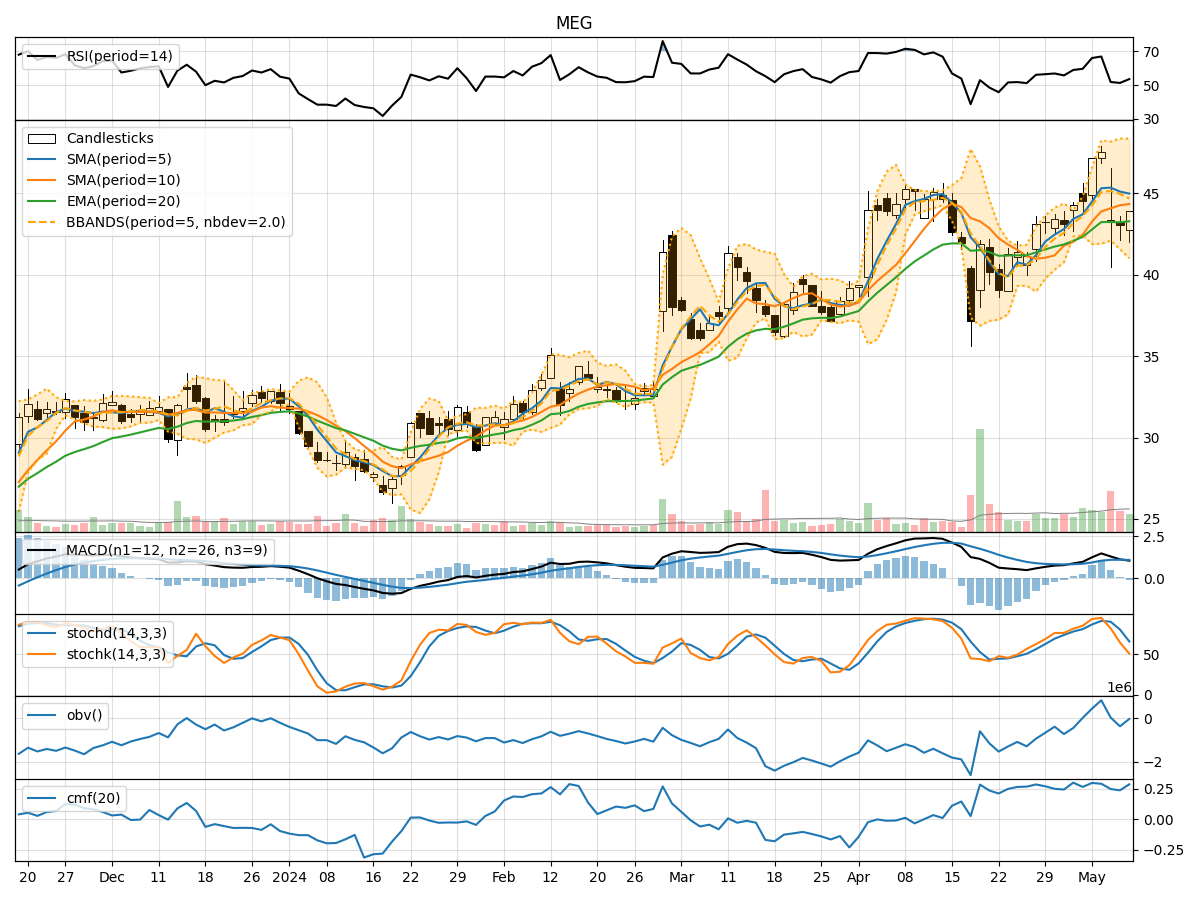
In analyzing the technical indicators for MEG over the last 5 days, we will delve into the trend, momentum, volatility, and volume indicators to provide a comprehensive outlook on the possible stock price movement in the coming days.
Trend Indicators:
- Moving Averages (MA): The 5-day Moving Average (MA) has been fluctuating around the mid $44 range, indicating some stability in the short term.
- MACD: The Moving Average Convergence Divergence (MACD) has shown positive values, suggesting a bullish momentum.
- EMA: The Exponential Moving Average (EMA) has been on an upward trend, indicating a positive momentum in the stock price.
Momentum Indicators:
- RSI: The Relative Strength Index (RSI) has been hovering around the mid-50s, indicating a neutral momentum.
- Stochastic Oscillator: The Stochastic Oscillator has been fluctuating but is currently in the oversold territory, suggesting a potential reversal.
- Williams %R: The Williams %R is also in the oversold region, indicating a possible buying opportunity.
Volatility Indicators:
- Bollinger Bands: The Bollinger Bands have shown narrowing bands, indicating decreasing volatility and a potential price breakout.
- Bollinger %B: The %B indicator is currently below 1, suggesting the stock price is trading below the lower band, indicating a possible oversold condition.
Volume Indicators:
- On-Balance Volume (OBV): The OBV has shown mixed signals, with fluctuations in volume but no clear trend.
- Chaikin Money Flow (CMF): The CMF has been positive, indicating buying pressure in the stock.
Key Observations and Opinions:
- Trend: The trend indicators suggest a positive momentum in the stock price, supported by the MACD and EMA.
- Momentum: The momentum indicators show a neutral to slightly oversold condition, indicating a potential reversal in the near term.
- Volatility: The narrowing Bollinger Bands suggest a period of consolidation, potentially followed by a breakout.
- Volume: The volume indicators are mixed, with no clear trend in volume accumulation.
Conclusion:
Based on the analysis of the technical indicators, the next few days' possible stock price movement for MEG is likely to be bullish. The positive trend indicators, coupled with the potential reversal signals from the momentum indicators, suggest a favorable outlook for the stock. Additionally, the narrowing Bollinger Bands indicate a period of consolidation before a potential breakout, further supporting the bullish view. Investors may consider accumulating positions in MEG for potential upside gains in the coming days.