Technical Analysis of NEM 2024-05-10
Overview:
In analyzing the technical indicators for NEM over the last 5 days, we will delve into the trend, momentum, volatility, and volume indicators to provide a comprehensive outlook on the possible stock price movement. By examining these key factors, we aim to offer valuable insights and predictions for the upcoming days.
Trend Analysis:
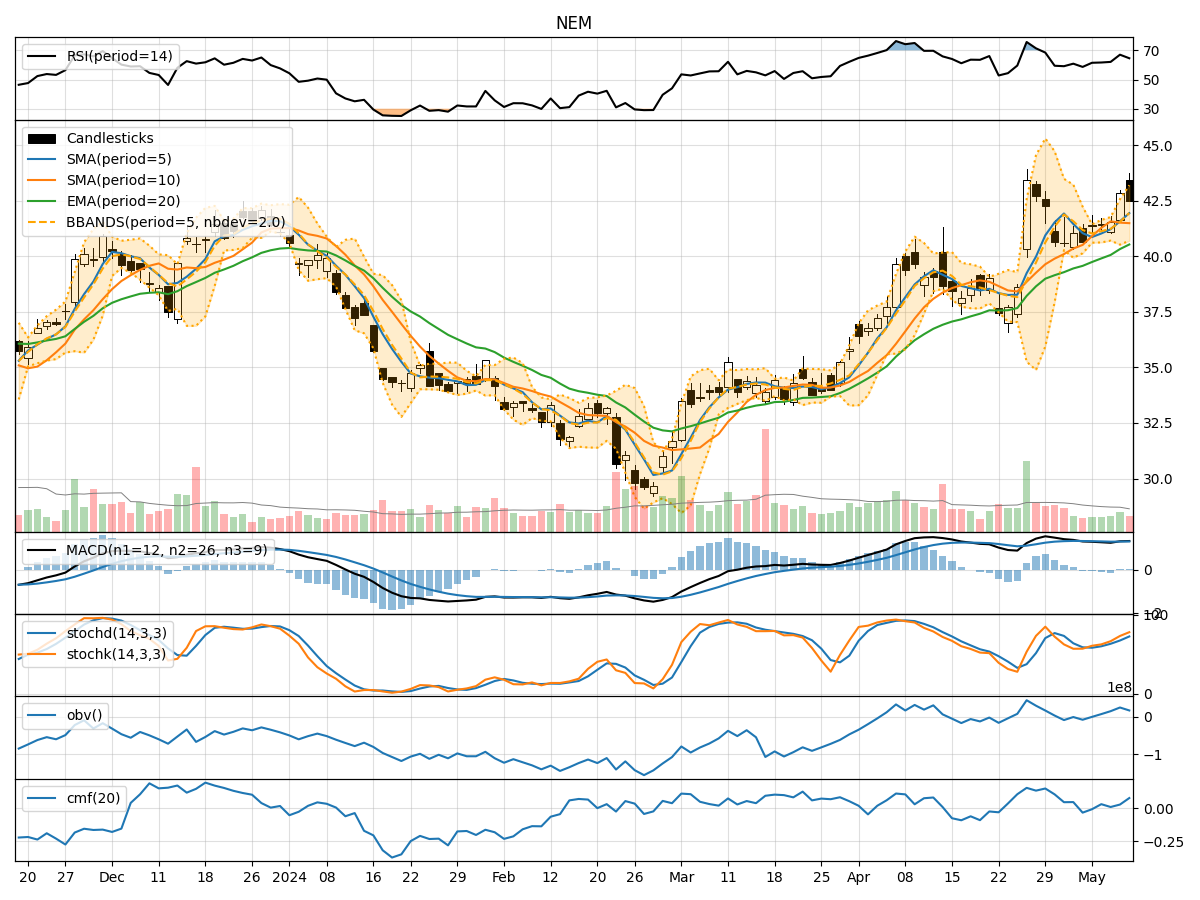
- Moving Averages (MA): The 5-day Moving Average (MA) has been consistently above the Simple Moving Average (SMA) and Exponential Moving Average (EMA), indicating a bullish trend.
- MACD: The MACD line has been above the signal line, with positive values, suggesting a bullish momentum in the stock price.
Key Observation: The trend indicators point towards a bullish sentiment in the stock price movement.
Momentum Analysis:
- RSI: The Relative Strength Index (RSI) has been above 50, indicating strength in the stock price momentum.
- Stochastic Oscillator: Both %K and %D have been in the overbought zone, suggesting a potential reversal or consolidation.
Key Observation: Momentum indicators show a mixed signal with a possibility of consolidation or a reversal.
Volatility Analysis:
- Bollinger Bands (BB): The stock price has been trading within the upper Bollinger Band (BBU), indicating increased volatility.
Key Observation: Volatility indicators suggest increased volatility in the stock price.
Volume Analysis:
- On-Balance Volume (OBV): The OBV has shown a positive trend, indicating accumulation of the stock.
- Chaikin Money Flow (CMF): The CMF has been positive, reflecting buying pressure in the stock.
Key Observation: Volume indicators signal positive accumulation and buying pressure in the stock.
Conclusion:
Based on the analysis of the technical indicators, the overall outlook for NEM stock price movement in the next few days is as follows: - Trend: The trend indicators suggest a bullish sentiment. - Momentum: Momentum indicators show a mixed signal with a potential for consolidation or a reversal. - Volatility: Volatility indicators point towards increased volatility. - Volume: Volume indicators indicate positive accumulation and buying pressure.
Overall Assessment:
Considering the bullish trend, mixed momentum, increased volatility, and positive volume accumulation, the next few days for NEM stock price could see upward movement with potential for consolidation or reversal in momentum. Traders should closely monitor key levels and be prepared for potential shifts in market dynamics.