Technical Analysis of NUVB 2024-05-10
Overview:
In analyzing the technical indicators for NUVB over the last 5 days, we will delve into the trend, momentum, volatility, and volume indicators to provide a comprehensive outlook on the possible stock price movement. By examining these key aspects, we aim to offer valuable insights and predictions for the upcoming days.
Trend Analysis:
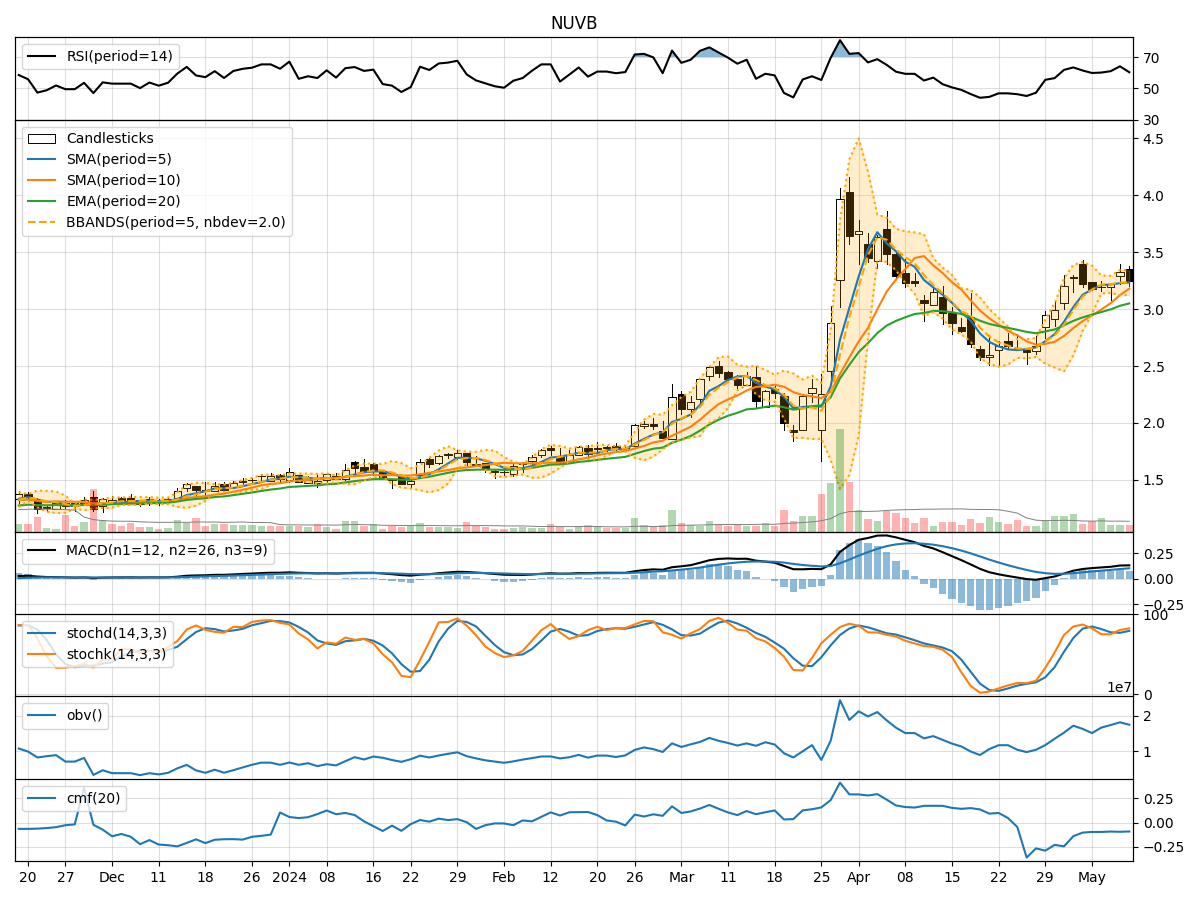
- Moving Averages (MA): The 5-day Moving Average (MA) has been steadily increasing, indicating a positive trend in the short term.
- MACD: The Moving Average Convergence Divergence (MACD) shows a consistent uptrend with the MACD line above the signal line, suggesting bullish momentum.
- EMA: The Exponential Moving Average (EMA) also reflects an upward trend, supporting the bullish sentiment.
Momentum Analysis:
- RSI: The Relative Strength Index (RSI) has been fluctuating around the overbought territory, indicating strong buying pressure.
- Stochastic Oscillator: Both %K and %D lines of the Stochastic Oscillator are in the overbought zone, signaling a potential reversal.
- Williams %R: The Williams %R is hovering in the oversold region, suggesting a possible buying opportunity.
Volatility Analysis:
- Bollinger Bands (BB): The Bollinger Bands are widening, indicating increased volatility in the stock price.
- Bollinger Band %B: The %B indicator is fluctuating within the bands, reflecting uncertainty in price direction.
- Bollinger Band Width: The Band Width is expanding, suggesting a potential breakout or breakdown.
Volume Analysis:
- On-Balance Volume (OBV): The OBV has been relatively stable, indicating a balance between buying and selling pressure.
- Chaikin Money Flow (CMF): The CMF is negative, suggesting outflows from the stock.
Key Observations:
- The trend indicators point towards a bullish sentiment in the short term.
- Momentum indicators show conflicting signals, with RSI indicating strength but Stochastic Oscillator hinting at a possible reversal.
- Volatility is increasing, which could lead to significant price movements.
- Volume indicators suggest a neutral stance with a slight inclination towards selling pressure.
Conclusion:
Based on the analysis of the technical indicators, the stock price of NUVB is likely to experience further upward movement in the coming days. The bullish trend supported by moving averages and MACD, coupled with the positive momentum indicated by RSI, suggests a potential continuation of the uptrend. However, traders should remain cautious of the conflicting signals from the Stochastic Oscillator and the increasing volatility, which could lead to short-term fluctuations. Overall, the outlook for NUVB appears bullish in the near future.