Technical Analysis of NXRT 2024-05-31
Overview:
In analyzing the technical indicators for NXRT over the last 5 days, we will delve into the trend, momentum, volatility, and volume indicators to provide a comprehensive assessment of the stock's potential price movement. By examining these key factors, we aim to offer valuable insights and predictions for the next few days.
Trend Analysis:
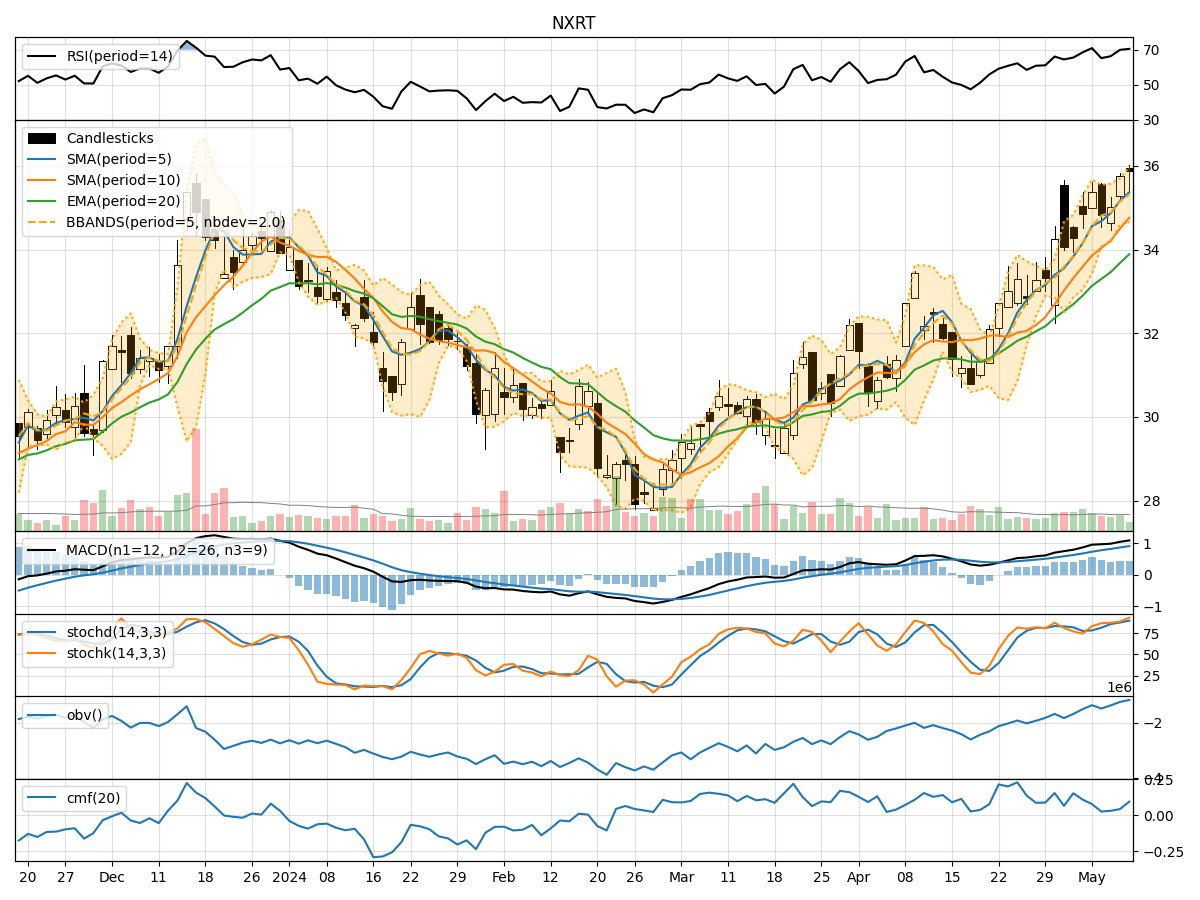
- Moving Averages (MA): The 5-day MA has been fluctuating around the closing prices, indicating short-term price trends. The SMA(10) and EMA(20) have shown slight variations but have generally followed the price movements.
- MACD: The MACD line has been positive, indicating a bullish trend, although the MACD Histogram has shown some decrease in bullish momentum over the period.
Momentum Analysis:
- RSI: The RSI has been fluctuating within the neutral to overbought territory, suggesting mixed momentum in the stock.
- Stochastic Oscillator: Both %K and %D have shown fluctuations but have generally been in the neutral zone, indicating indecision in the market.
- Williams %R: The Williams %R has shown oscillations between oversold and neutral levels, reflecting uncertainty in price direction.
Volatility Analysis:
- Bollinger Bands (BB): The stock price has mostly stayed within the bands, with the %B indicator hovering around the midline, suggesting moderate volatility.
Volume Analysis:
- On-Balance Volume (OBV): The OBV has shown mixed movements, indicating indecision among investors regarding the stock.
- Chaikin Money Flow (CMF): The CMF has been negative, suggesting that money flow has been predominantly out of the stock over the period.
Key Observations:
- The trend indicators show a mixed picture with some bullish signals from the MACD but a decrease in momentum as seen in the MACD Histogram.
- Momentum indicators reflect indecision and lack of a clear trend, with RSI and Stochastic oscillating in neutral zones.
- Volatility has been moderate, as indicated by the Bollinger Bands, with the stock price mostly contained within the bands.
- Volume indicators suggest a lack of strong buying or selling pressure, with OBV and CMF showing mixed movements.
Conclusion:
Based on the analysis of the technical indicators, the next few days for NXRT could see sideways movement with limited volatility. The lack of clear trends in both the trend and momentum indicators, coupled with mixed volume signals, indicates a period of consolidation and indecision in the market. Traders may expect the stock price to remain range-bound in the near term, with no strong bias towards either bullish or bearish movements. It is advisable to closely monitor key support and resistance levels for potential breakout opportunities.