Technical Analysis of PATH 2024-05-10
Overview:
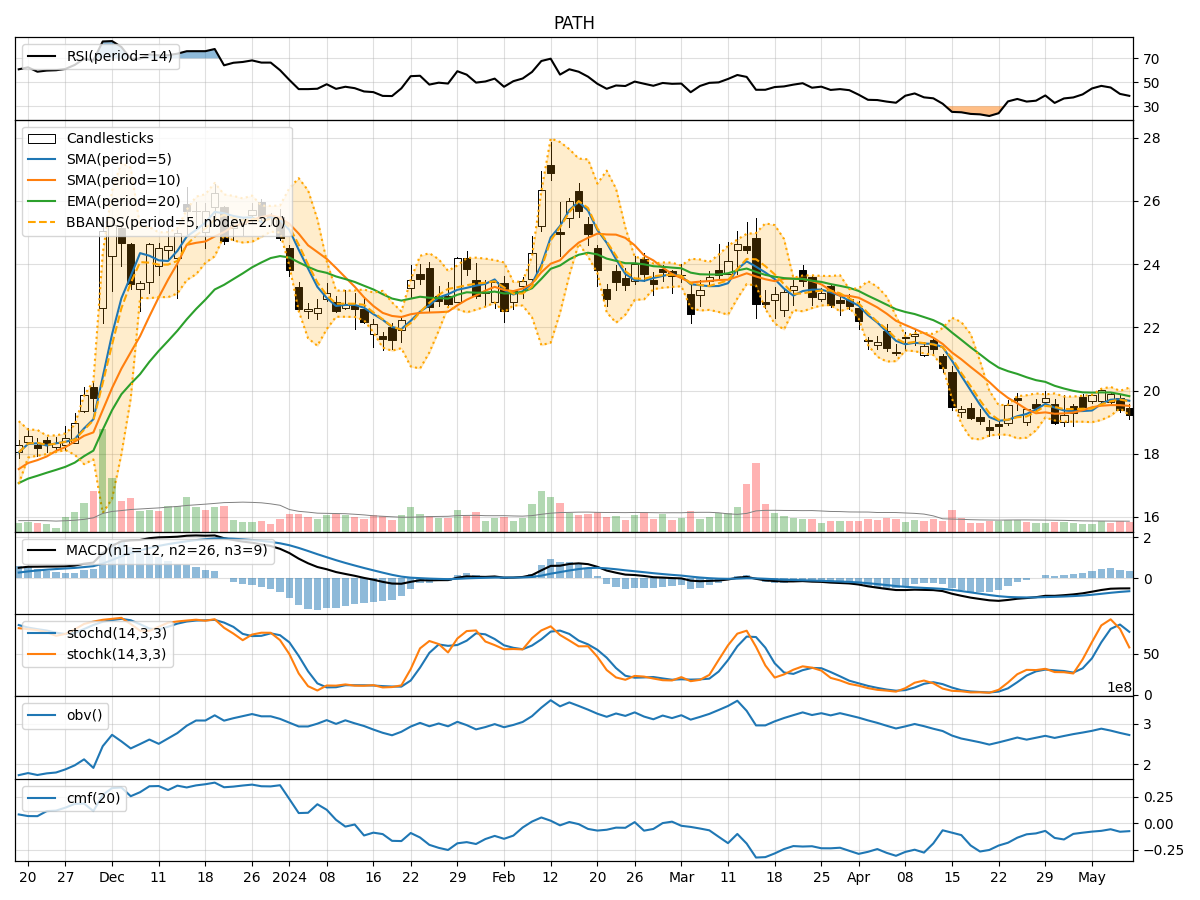
In analyzing the technical indicators for PATH stock over the last 5 days, we will delve into the trend, momentum, volatility, and volume indicators to provide a comprehensive outlook on the possible future stock price movement. By examining these key indicators, we aim to offer valuable insights and recommendations for potential investors.
Trend Analysis:
- Moving Averages (MA): The 5-day Moving Average (MA) has been fluctuating around the closing prices, indicating a short-term trend. The Simple Moving Average (SMA) and Exponential Moving Average (EMA) show a slight downward trend, with the EMA lagging behind.
- MACD: The Moving Average Convergence Divergence (MACD) has been negative, suggesting a bearish momentum in the stock price.
- Conclusion: The trend indicators point towards a downward trend in the stock price.
Momentum Analysis:
- RSI: The Relative Strength Index (RSI) has been decreasing, indicating a weakening momentum in the stock.
- Stochastic Oscillator: Both %K and %D have been declining, signaling a bearish momentum.
- Conclusion: The momentum indicators suggest a bearish sentiment in the stock.
Volatility Analysis:
- Bollinger Bands (BB): The Bollinger Bands have been narrowing, indicating decreasing volatility in the stock price.
- Conclusion: The volatility indicators suggest a decreasing volatility in the stock.
Volume Analysis:
- On-Balance Volume (OBV): The OBV has been consistently negative, indicating a higher selling volume compared to buying volume.
- Chaikin Money Flow (CMF): The CMF has been negative, reflecting a bearish money flow in the stock.
- Conclusion: The volume indicators suggest a bearish sentiment in the stock.
Overall Conclusion:
Based on the analysis of trend, momentum, volatility, and volume indicators, the overall outlook for PATH stock in the next few days appears to be bearish. The trend is downward, momentum is weakening, volatility is decreasing, and volume is skewed towards selling pressure. Therefore, it is likely that the stock price may experience further downward movement in the coming days.
Recommendation:
Considering the bearish signals across multiple technical indicators, it is advisable for investors to exercise caution when considering investments in PATH stock. It may be prudent to wait for more positive signals or confirmation of a trend reversal before considering any long positions. Short-term traders could potentially explore shorting opportunities based on the current technical outlook.
Disclaimer:
It is important to note that technical analysis is not a guaranteed predictor of future price movements, and other fundamental factors can also influence stock prices. Investors should conduct thorough research and consider multiple indicators before making any investment decisions. Consulting with a financial advisor is recommended for personalized investment advice tailored to individual risk tolerance and financial goals.