Technical Analysis of PFE 2024-05-10
Overview:
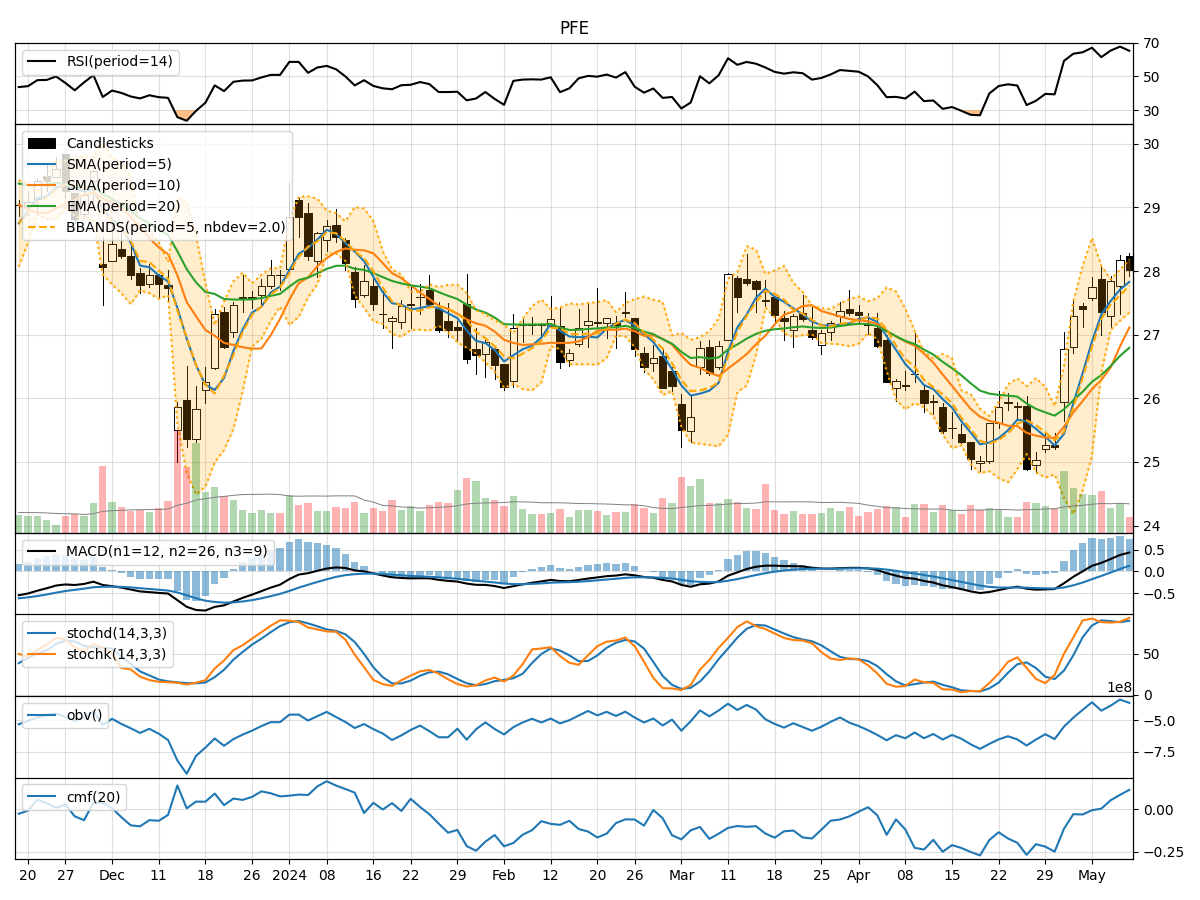
In analyzing the technical indicators for Pfizer (PFE) over the last 5 days, we will delve into the trend, momentum, volatility, and volume indicators to provide a comprehensive outlook on the possible stock price movement. By examining these key factors, we aim to offer valuable insights and predictions for the upcoming days.
Trend Indicators:
- Moving Averages (MA): The 5-day moving average has been consistently above the longer-term simple moving average (SMA) and exponential moving average (EMA), indicating a bullish trend.
- MACD: The MACD line has been above the signal line for the past few days, suggesting positive momentum in the stock price.
- RSI: The Relative Strength Index (RSI) has been in the overbought territory, indicating a strong bullish momentum.
Momentum Indicators:
- Stochastic Oscillator: The Stochastic Oscillator has been fluctuating in the overbought region, suggesting a potential reversal or consolidation.
- Williams %R: The Williams %R has been in the oversold region, indicating a possible buying opportunity.
Volatility Indicators:
- Bollinger Bands: The Bollinger Bands have been relatively narrow, indicating low volatility in the stock price.
- Average True Range (ATR): The ATR has been relatively stable, suggesting consistent price movements.
Volume Indicators:
- On-Balance Volume (OBV): The OBV has shown mixed signals, with some days seeing an increase in volume and others experiencing a decrease.
- Chaikin Money Flow (CMF): The CMF has been positive, indicating buying pressure in the stock.
Key Observations:
- The trend indicators suggest a bullish sentiment in the stock price, supported by moving averages and MACD.
- Momentum indicators show conflicting signals, with the Stochastic Oscillator hinting at a potential reversal while the Williams %R indicates a buying opportunity.
- Volatility indicators point towards low volatility, which may lead to a period of consolidation.
- Volume indicators reflect mixed signals, with OBV showing some accumulation and distribution phases.
Conclusion:
Based on the analysis of the technical indicators, the stock price of Pfizer (PFE) is likely to experience sideways movement or consolidation in the upcoming days. While the trend indicators remain bullish, the conflicting signals from momentum indicators and the low volatility environment suggest a period of indecision in the market. Traders and investors should closely monitor key support and resistance levels for potential breakout opportunities.