Technical Analysis of RBOT 2024-05-10
Overview:
In analyzing the technical indicators for RBOT stock over the last 5 days, we will delve into the trend, momentum, volatility, and volume indicators to provide a comprehensive outlook on the possible stock price movement in the coming days. By examining these key indicators, we aim to offer valuable insights and recommendations for potential investors.
Trend Analysis:
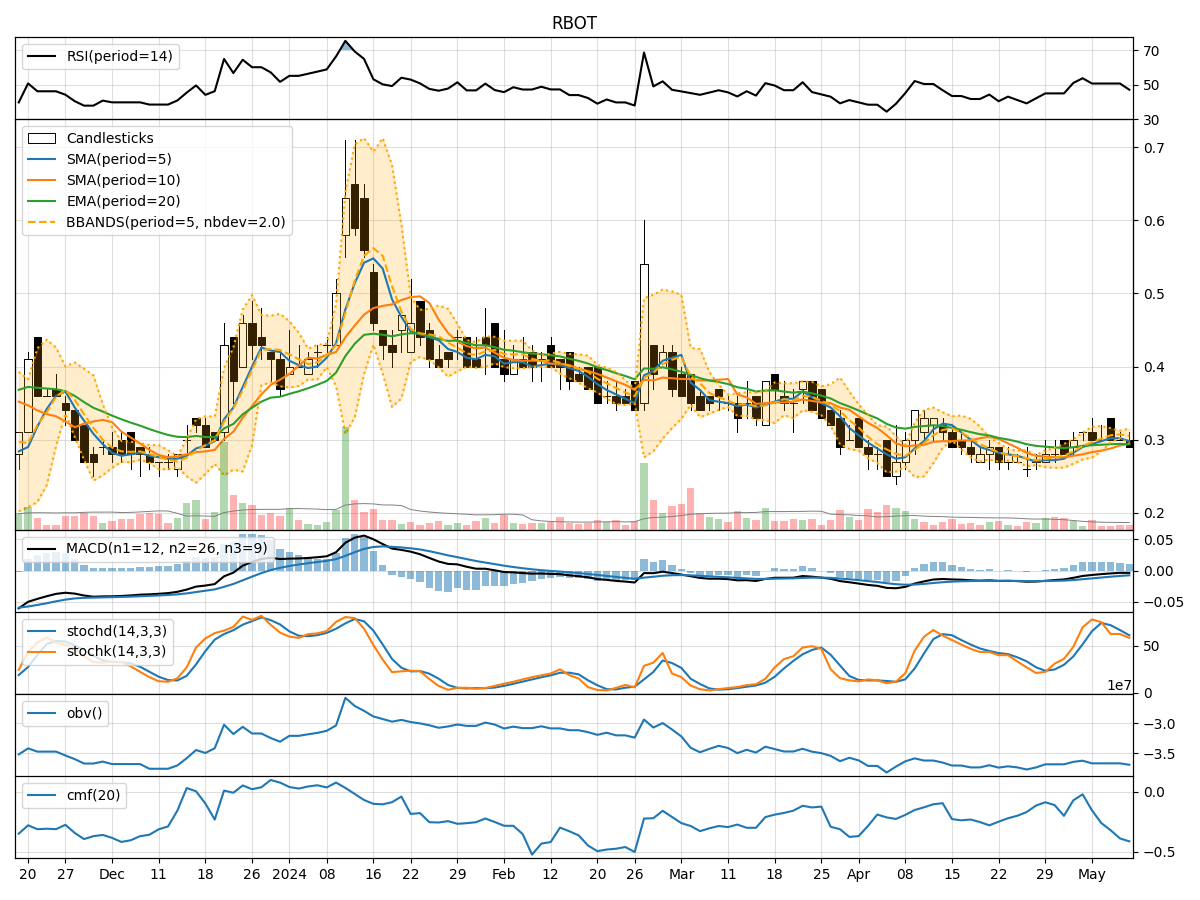
- Moving Averages (MA): The 5-day Moving Average (MA) has been relatively stable around $0.30, indicating a consistent price level.
- MACD: The Moving Average Convergence Divergence (MACD) has been negative, suggesting a bearish trend in the short term.
- EMA: The Exponential Moving Average (EMA) has shown a slight downward trend, reflecting potential weakness in price momentum.
Momentum Analysis:
- RSI: The Relative Strength Index (RSI) has been hovering around 50, indicating a neutral momentum.
- Stochastic Oscillator: Both %K and %D have been declining, signaling a potential bearish momentum.
- Williams %R: The indicator has been in oversold territory, suggesting a possible reversal in momentum.
Volatility Analysis:
- Bollinger Bands: The bands have been narrowing, indicating decreasing volatility and a potential price breakout.
- Bollinger %B: The %B indicator has been close to 0, suggesting a possible oversold condition.
Volume Analysis:
- On-Balance Volume (OBV): The OBV has been negative, indicating selling pressure in the stock.
- Chaikin Money Flow (CMF): The CMF has been consistently negative, reflecting a lack of buying interest.
Key Observations:
- The stock has been trading in a tight range around $0.30 with a bearish bias in the short term.
- Momentum indicators suggest a potential shift towards bearish sentiment.
- Volatility has been decreasing, indicating a possible period of consolidation.
- Volume indicators point towards selling pressure and a lack of significant buying interest.
Conclusion:
Based on the analysis of the technical indicators, the outlook for RBOT stock in the next few days is bearish. The stock is likely to experience further downward pressure, potentially testing lower support levels. Traders should exercise caution and consider short-term selling strategies or wait for a clearer signal of a trend reversal before considering long positions. It is advisable to closely monitor key support levels and any potential catalysts that could impact the stock price movement.