Technical Analysis of REX 2024-05-03
Overview:
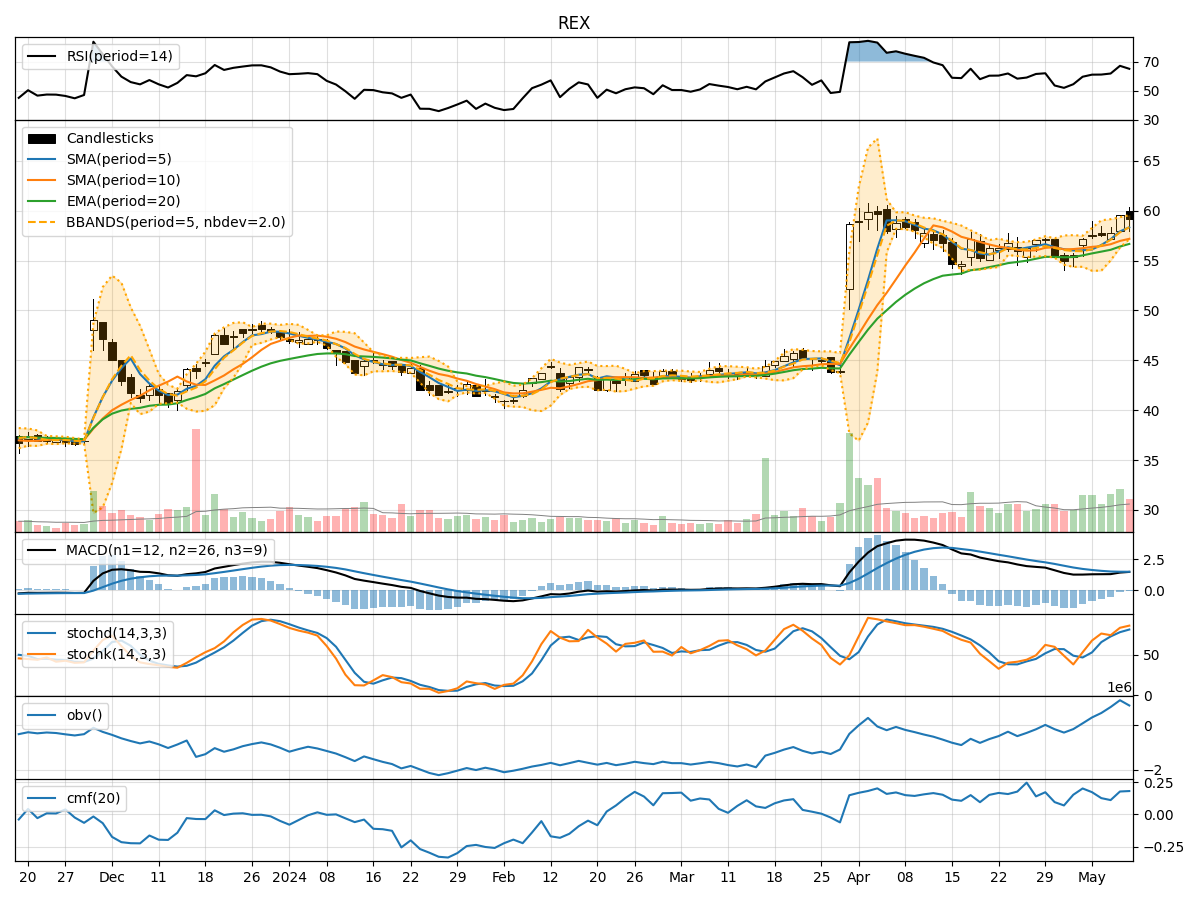
In analyzing the technical indicators for REX stock over the last 5 days, we will delve into the trend, momentum, volatility, and volume indicators to provide a comprehensive outlook on the possible stock price movement in the coming days.
Trend Indicators:
- Moving Averages (MA): The 5-day MA has been consistently above the closing prices, indicating a short-term uptrend.
- MACD: The MACD line has been above the signal line, suggesting bullish momentum.
- EMA: The exponential moving average has been trending upwards, supporting the bullish sentiment.
Momentum Indicators:
- RSI: The RSI has been fluctuating but generally staying above 50, indicating bullish momentum.
- Stochastic Oscillator: Both %K and %D have shown mixed signals, with %K crossing %D, suggesting potential reversal.
- Williams %R: The indicator has been fluctuating in the oversold region, indicating a possible buying opportunity.
Volatility Indicators:
- Bollinger Bands: The stock price has been trading within the bands, with the bands narrowing, suggesting a potential breakout.
- Bollinger %B: The %B indicator has been fluctuating around 0.5, indicating a balanced market sentiment.
Volume Indicators:
- On-Balance Volume (OBV): The OBV has been increasing, indicating accumulation by investors.
- Chaikin Money Flow (CMF): The CMF has been positive, suggesting buying pressure in the stock.
Key Observations:
- The trend indicators point towards a bullish sentiment, supported by moving averages and MACD.
- Momentum indicators show mixed signals, with RSI indicating bullish momentum but stochastic oscillators suggesting a potential reversal.
- Volatility indicators hint at a potential breakout as the Bollinger Bands narrow.
- Volume indicators indicate accumulation and buying pressure in the stock.
Conclusion:
Based on the analysis of the technical indicators, the overall outlook for REX stock in the next few days is bullish. The trend indicators support a continuation of the uptrend, while momentum indicators show some caution. Volatility indicators suggest a potential breakout, and volume indicators indicate positive investor sentiment. Therefore, it is likely that the stock price will experience upward movement in the coming days. Traders and investors may consider taking long positions or holding onto existing positions with appropriate risk management strategies.