Technical Analysis of S 2024-05-10
Overview:
In analyzing the technical indicators for the last 5 days, we will delve into the trend, momentum, volatility, and volume indicators to forecast the possible stock price movement for the next few days. By examining these key indicators, we aim to provide a comprehensive and insightful analysis to guide your decision-making process.
Trend Indicators:
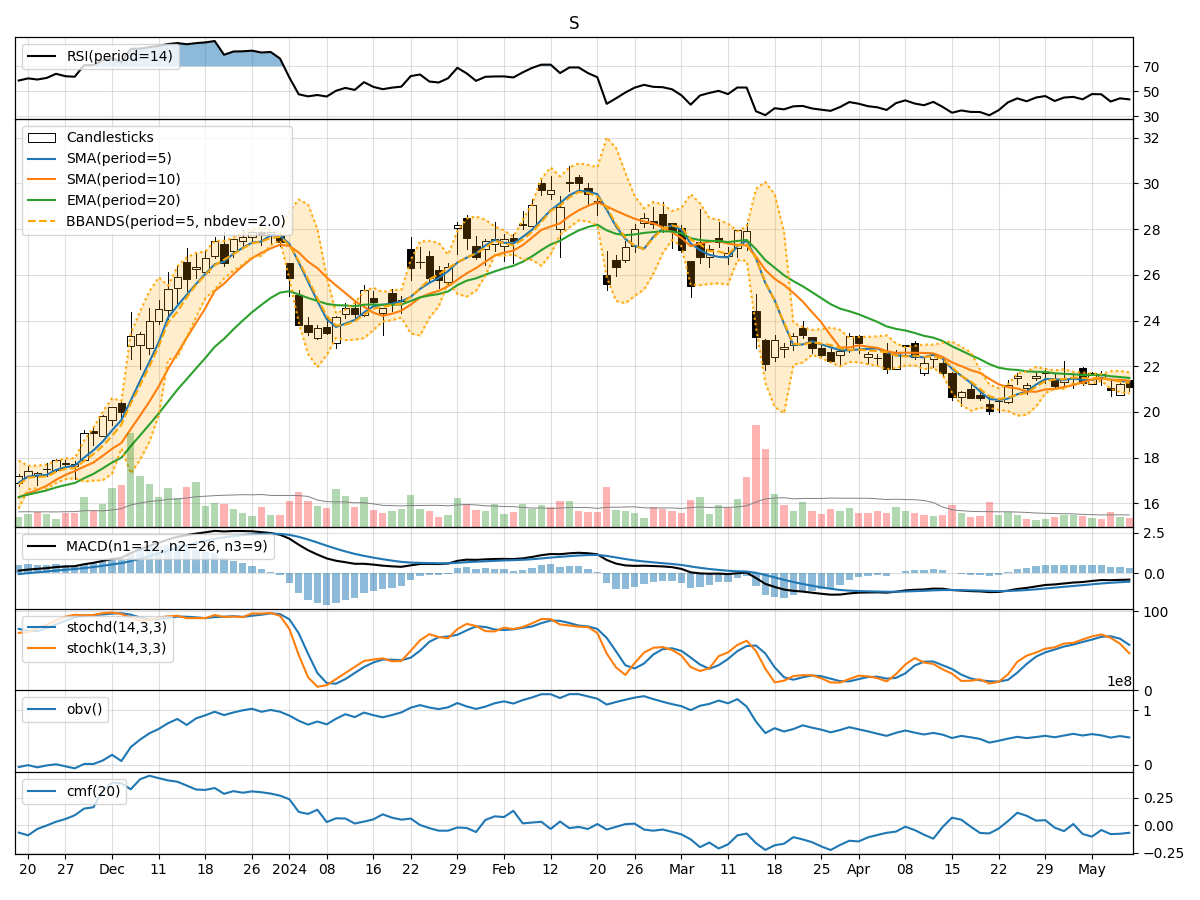
- Moving Averages (MA): The 5-day moving average (MA) has been fluctuating around the closing prices, indicating short-term price trends. The Simple Moving Average (SMA) and Exponential Moving Average (EMA) show a slight downward trend, suggesting a potential bearish sentiment.
- Moving Average Convergence Divergence (MACD): The MACD and Signal line have been negative, indicating a bearish trend in the stock price.
- Conclusion: The trend indicators suggest a bearish outlook for the stock in the short term.
Momentum Indicators:
- Relative Strength Index (RSI): The RSI has been hovering around the neutral zone, indicating a lack of strong momentum in either direction.
- Stochastic Oscillator: Both %K and %D have been declining, signaling a potential weakening of buying pressure.
- Williams %R (Willams %R): The Williams %R is in the oversold territory, suggesting a possible reversal in the near future.
- Conclusion: The momentum indicators reflect a neutral to slightly bearish sentiment in the stock's momentum.
Volatility Indicators:
- Bollinger Bands (BB): The Bollinger Bands have been narrowing, indicating decreasing volatility in the stock price.
- Conclusion: The volatility indicators suggest a decreasing volatility environment, potentially leading to a period of consolidation or a breakout.
Volume Indicators:
- On-Balance Volume (OBV): The OBV has been declining, indicating a decrease in buying volume over the past few days.
- Chaikin Money Flow (CMF): The CMF has been negative, suggesting a lack of strong buying pressure.
- Conclusion: The volume indicators point towards a weakening buying volume in the stock.
Overall Conclusion:
Based on the analysis of the trend, momentum, volatility, and volume indicators, the overall outlook for the stock in the next few days is bearish. The trend indicators show a downward trend, supported by the negative MACD. Momentum indicators suggest a lack of strong buying pressure, while volatility is decreasing, possibly leading to consolidation. Additionally, the volume indicators indicate a weakening buying volume. Therefore, it is likely that the stock price may experience a downward movement in the upcoming trading sessions.
Recommendation:
Considering the bearish outlook, it is advisable to exercise caution and consider potential short-selling opportunities or implementing risk management strategies to protect against downside risk. Monitoring key support levels and waiting for confirmation signals before entering any positions would be prudent in the current market environment.