Technical Analysis of SES 2024-05-10
Overview:
In analyzing the technical indicators for SES stock over the last 5 days, we will delve into the trend, momentum, volatility, and volume indicators to provide a comprehensive outlook on the possible stock price movement in the coming days. By examining these key indicators, we aim to offer valuable insights and predictions for potential investors.
Trend Analysis:
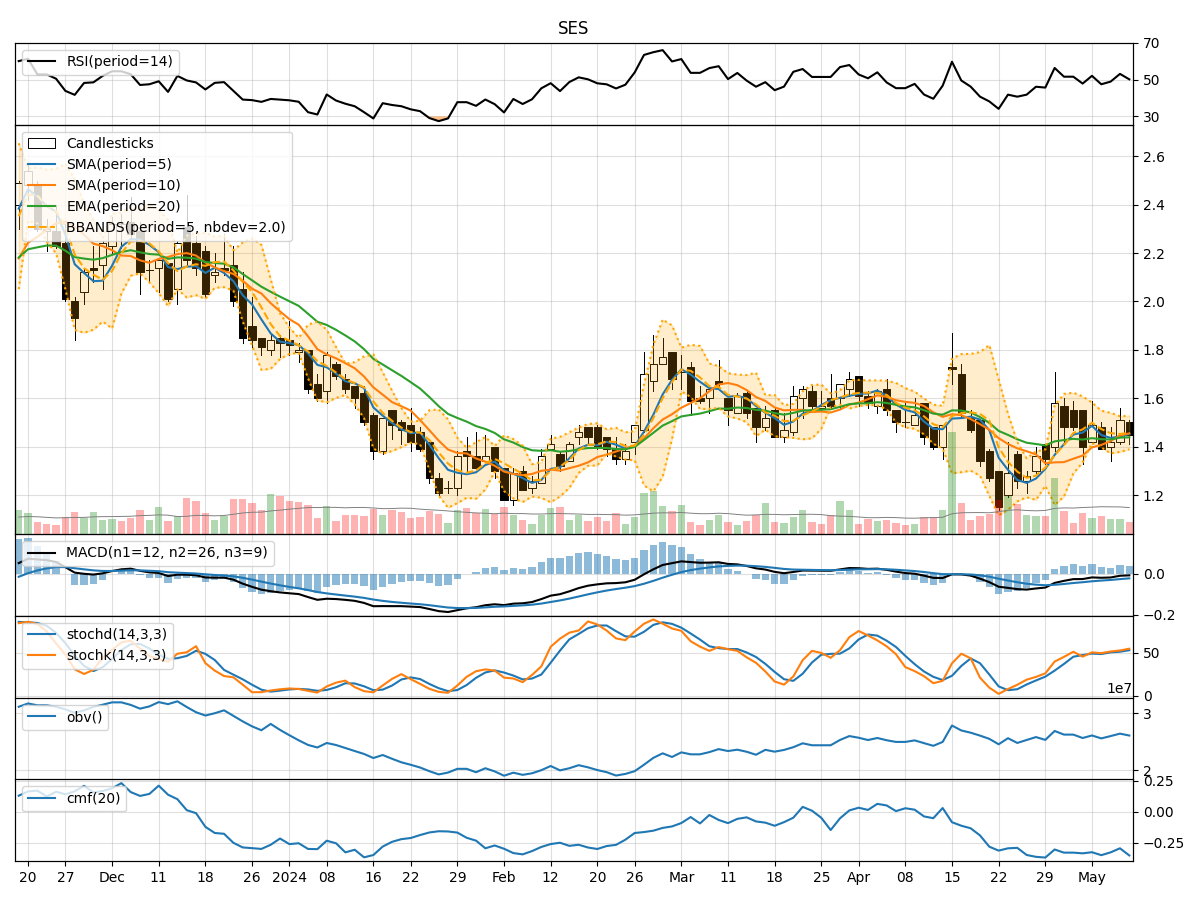
- Moving Averages (MA): The 5-day Moving Average (MA) has been fluctuating around the current stock price, indicating short-term price stability.
- MACD: The Moving Average Convergence Divergence (MACD) has been negative but showing signs of convergence, suggesting a potential reversal in the downtrend.
- EMA: The Exponential Moving Average (EMA) has been relatively flat, reflecting a lack of strong trend direction.
Momentum Analysis:
- RSI: The Relative Strength Index (RSI) has been hovering around the neutral zone, indicating a balanced momentum between buying and selling pressure.
- Stochastic Oscillator: Both %K and %D have been fluctuating, suggesting indecision in the market.
- Williams %R: The Williams %R is showing oversold conditions, potentially signaling a reversal in the short term.
Volatility Analysis:
- Bollinger Bands (BB): The Bollinger Bands have been narrowing, indicating decreasing volatility and a possible period of consolidation.
- BB%: The %B indicator has been fluctuating within a narrow range, reflecting a lack of significant price movement.
Volume Analysis:
- On-Balance Volume (OBV): The OBV has been relatively stable, indicating a balance between buying and selling pressure.
- Chaikin Money Flow (CMF): The CMF has been negative, suggesting outflow of money from the stock.
Key Observations:
- The trend indicators show a lack of clear direction in the stock price movement.
- Momentum indicators suggest a neutral stance with a slight bearish bias.
- Volatility indicators point towards a period of consolidation and decreased price fluctuations.
- Volume indicators reflect a balanced market sentiment with a slight bearish bias.
Conclusion:
Based on the analysis of the technical indicators, the next few days for SES stock are likely to see sideways movement with a slight bearish bias. The lack of strong trend direction, coupled with neutral to bearish momentum and volume signals, indicates a period of consolidation and indecision in the market. Traders may expect the stock price to remain range-bound with limited upside potential in the short term. It is advisable to closely monitor key support and resistance levels for potential breakout or breakdown scenarios.