Technical Analysis of SID 2024-05-10
Overview:
In analyzing the technical indicators for SID stock over the last 5 days, we will delve into the trend, momentum, volatility, and volume indicators to provide a comprehensive outlook on the possible stock price movement in the upcoming days.
Trend Analysis:
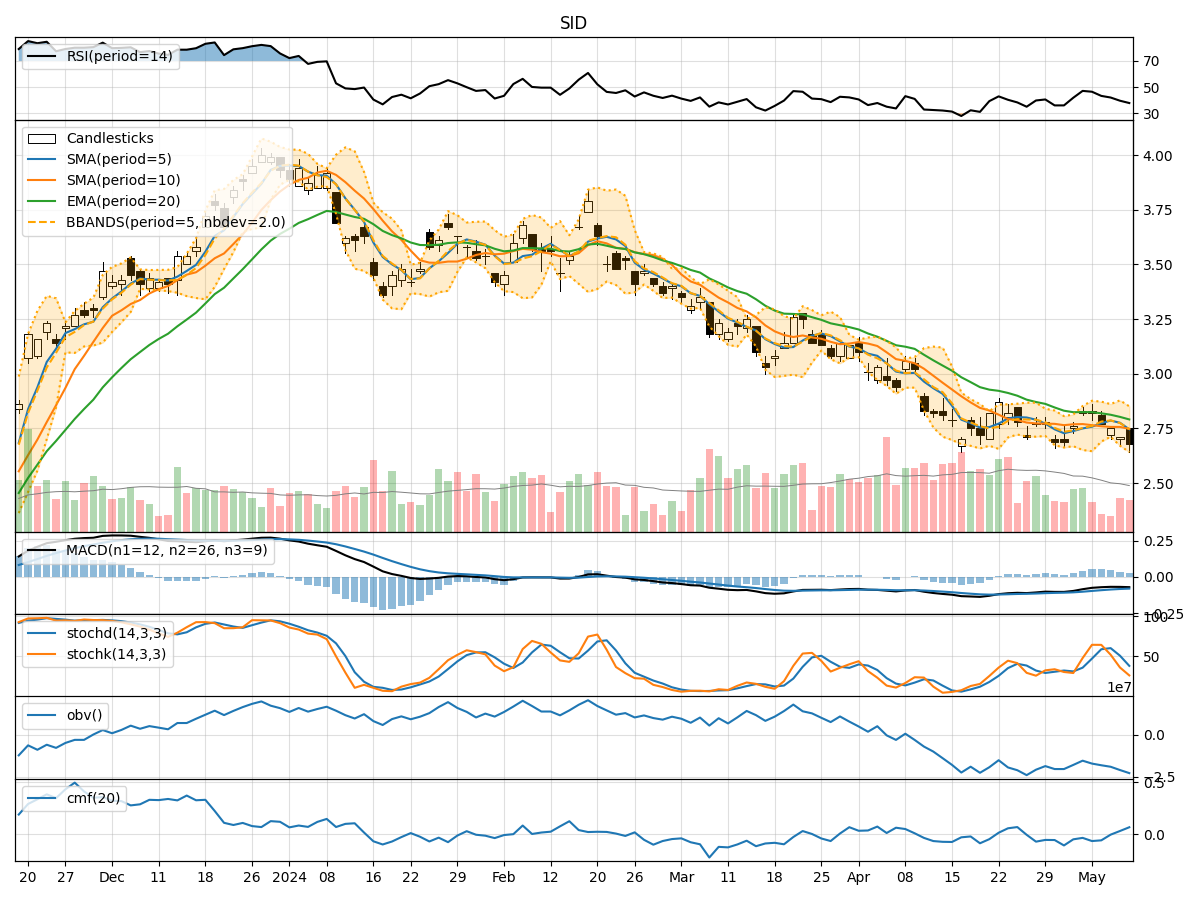
- Moving Averages (MA): The 5-day Moving Average (MA) has been declining, indicating a short-term bearish trend.
- MACD: The MACD line has been consistently below the signal line, suggesting a bearish momentum.
- EMA: The Exponential Moving Average (EMA) has been decreasing, further supporting the bearish trend.
Momentum Analysis:
- RSI: The Relative Strength Index (RSI) has been declining, indicating weakening momentum.
- Stochastic Oscillator: Both %K and %D have been decreasing, signaling a bearish momentum.
- Williams %R: The indicator has been in oversold territory, suggesting a potential reversal.
Volatility Analysis:
- Bollinger Bands: The stock price has been trading within the lower Bollinger Band, indicating a potential oversold condition.
- Bollinger %B: The %B indicator has been increasing slightly, but still within the lower range, suggesting a possible bounce back.
Volume Analysis:
- On-Balance Volume (OBV): The OBV has been declining, indicating selling pressure in the stock.
- Chaikin Money Flow (CMF): The CMF has been negative, reflecting a lack of buying interest.
Key Observations:
- The stock is currently in a short-term bearish trend based on moving averages and MACD.
- Momentum indicators suggest a weakening trend with potential for a reversal due to oversold conditions.
- Volatility indicators point towards a possible bounce back as the stock is trading near the lower Bollinger Band.
- Volume indicators show selling pressure and a lack of significant buying interest.
Conclusion:
Based on the analysis of the technical indicators, the stock price of SID is likely to experience a short-term consolidation or a minor rebound in the upcoming days. However, the overall trend remains bearish, and caution should be exercised in expecting a significant upward movement. Traders may consider waiting for more confirmation of a trend reversal before considering long positions.