Technical Analysis of SPOT 2024-05-03
Overview:
In analyzing the technical indicators for SPOT over the last 5 days, we will delve into the trend, momentum, volatility, and volume indicators to provide a comprehensive outlook on the possible stock price movement. By examining these key aspects, we aim to offer valuable insights and predictions for the upcoming days.
Trend Analysis:
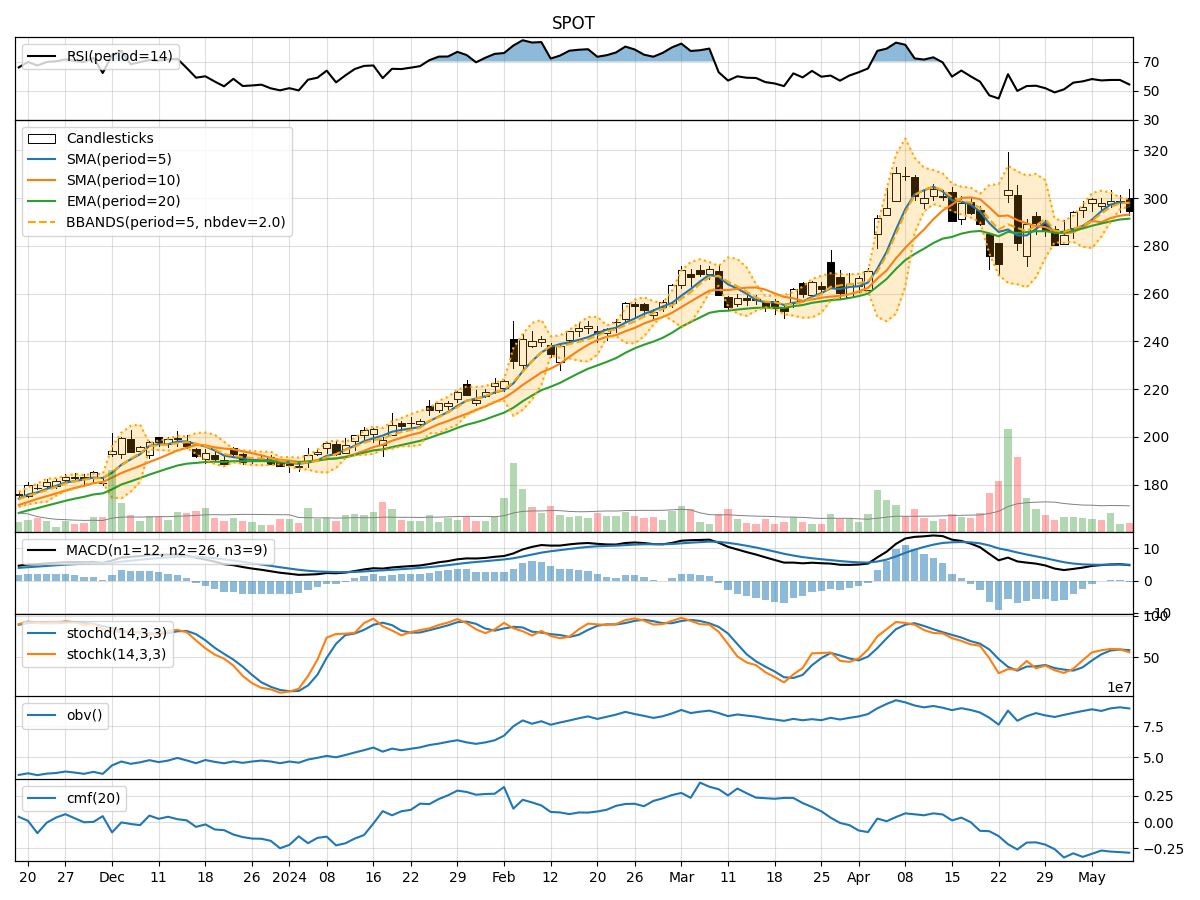
- Moving Averages (MA): The 5-day Moving Average (MA) has been fluctuating around the actual closing prices, indicating short-term price trends. The Simple Moving Average (SMA) and Exponential Moving Average (EMA) show a slight divergence, suggesting potential shifts in momentum.
- MACD: The Moving Average Convergence Divergence (MACD) has been negative, with the MACD line consistently below the signal line. This indicates a bearish trend in the short term.
Momentum Analysis:
- RSI: The Relative Strength Index (RSI) has been hovering around the 50 level, indicating a neutral stance in momentum.
- Stochastic Oscillator: Both %K and %D lines of the Stochastic Oscillator have shown mixed signals, with occasional crossovers, reflecting indecision in the market sentiment.
Volatility Analysis:
- Bollinger Bands (BB): The Bollinger Bands have been widening, suggesting increased price volatility. The current price is closer to the upper band, indicating a potential overbought condition.
- Bollinger %B: The %B indicator has been fluctuating, but the recent values suggest a potential pullback in price.
Volume Analysis:
- On-Balance Volume (OBV): The OBV indicator has shown a slight increase, indicating some accumulation of the stock.
- Chaikin Money Flow (CMF): The CMF has been negative, signaling a lack of buying pressure in the market.
Key Observations and Opinions:
- Trend: The trend indicators point towards a bearish sentiment in the short term, with the MACD confirming a negative momentum.
- Momentum: The momentum indicators suggest a neutral stance, with no clear direction in the near future.
- Volatility: Increasing volatility, as indicated by the widening Bollinger Bands, could lead to sharp price movements.
- Volume: The volume indicators show mixed signals, with OBV slightly positive but CMF indicating a lack of strong buying interest.
Conclusion:
Based on the analysis of the technical indicators, the overall outlook for SPOT in the next few days leans towards a downward trend. The bearish signals from the trend indicators, coupled with the lack of strong momentum and mixed volume signals, suggest that the stock price may experience further downside movement. Traders and investors should exercise caution and consider implementing risk management strategies in anticipation of potential price declines.