Technical Analysis of TAP 2024-05-10
Overview:
In analyzing the technical indicators for TAP stock over the last 5 days, we will delve into the trend, momentum, volatility, and volume indicators to provide a comprehensive outlook on the possible stock price movement in the coming days. By examining these key indicators, we aim to offer valuable insights and predictions for informed decision-making.
Trend Analysis:
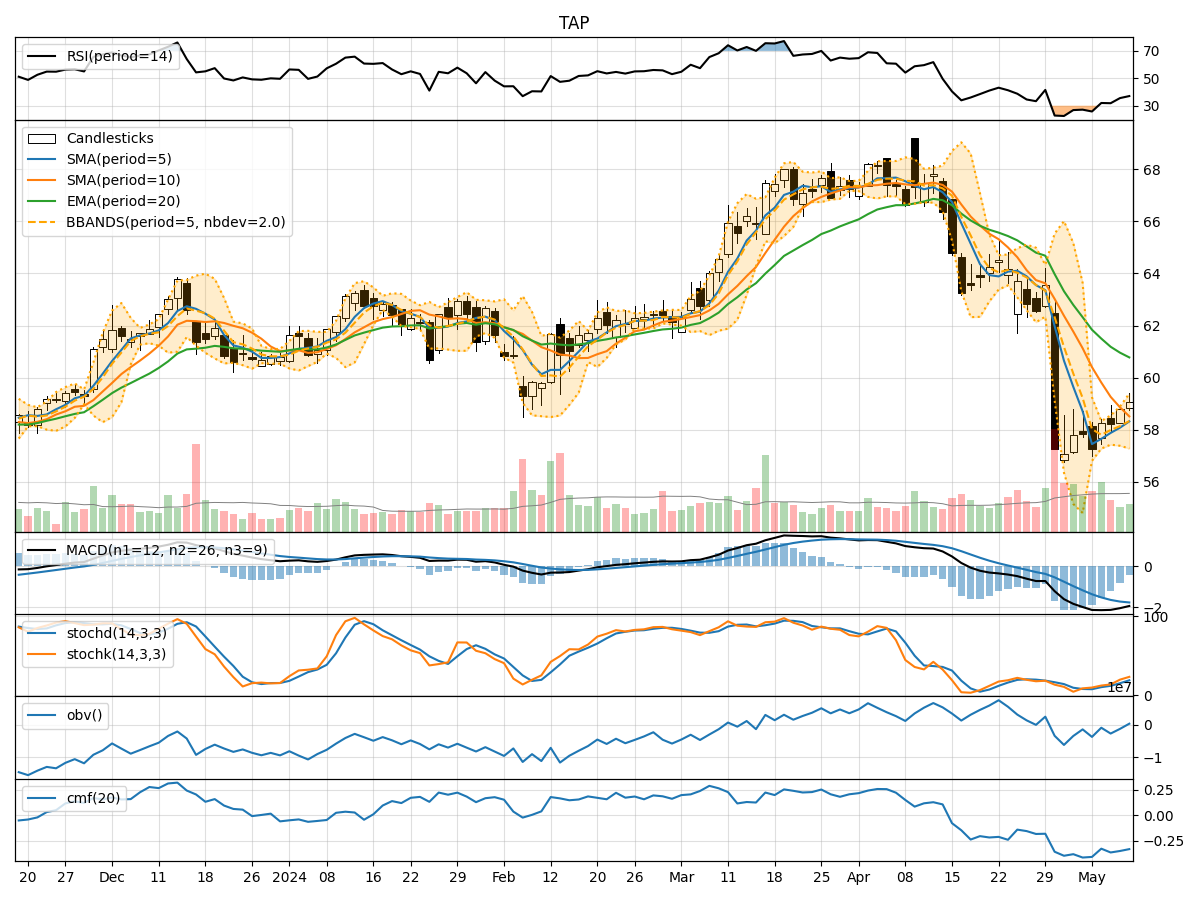
- Moving Averages (MA): The 5-day Moving Average (MA) has been gradually decreasing, indicating a downward trend in the stock price.
- MACD: The Moving Average Convergence Divergence (MACD) has been consistently negative, suggesting bearish momentum in the stock.
- EMA: The Exponential Moving Average (EMA) has also been declining, reinforcing the bearish sentiment in the stock.
Momentum Analysis:
- RSI: The Relative Strength Index (RSI) has been increasing, but it remains below the overbought threshold, indicating a potential for further upside momentum.
- Stochastic Oscillator: Both %K and %D of the Stochastic Oscillator have been rising, signaling increasing buying pressure in the stock.
- Williams %R: The Williams %R is moving towards the oversold territory, suggesting a possible reversal in the stock price.
Volatility Analysis:
- Bollinger Bands: The Bollinger Bands are widening, indicating increased volatility in the stock price.
- Bollinger %B: The %B indicator is below 1, suggesting that the stock price is trading below the lower Bollinger Band, potentially indicating an oversold condition.
Volume Analysis:
- On-Balance Volume (OBV): The OBV has been fluctuating, indicating mixed buying and selling pressure in the stock.
- Chaikin Money Flow (CMF): The CMF has been negative, suggesting a lack of buying pressure in the stock.
Key Observations:
- The trend indicators point towards a bearish sentiment in the stock, with moving averages and MACD signaling a downward trend.
- Momentum indicators show a potential for a reversal in the stock price, with RSI and Stochastic Oscillator indicating increasing buying pressure.
- Volatility indicators suggest heightened volatility in the stock, potentially leading to significant price movements.
- Volume indicators reflect mixed sentiment, with OBV fluctuating and CMF indicating a lack of strong buying pressure.
Conclusion:
Based on the analysis of the technical indicators, the next few days' possible stock price movement for TAP stock is likely to experience a short-term bullish reversal. Despite the bearish trend indicated by moving averages and MACD, the momentum indicators suggest a potential for an upward movement in the stock price. The increasing RSI and Stochastic Oscillator, coupled with the oversold condition indicated by Williams %R, point towards a possible bullish momentum in the coming days. However, traders should remain cautious due to the heightened volatility as indicated by the Bollinger Bands and the mixed volume signals from OBV and CMF.