Technical Analysis of TLK 2024-05-10
Overview:
In analyzing the technical indicators for TLK over the last 5 days, we will delve into the trend, momentum, volatility, and volume indicators to provide a comprehensive outlook on the possible stock price movement in the coming days.
Trend Analysis:
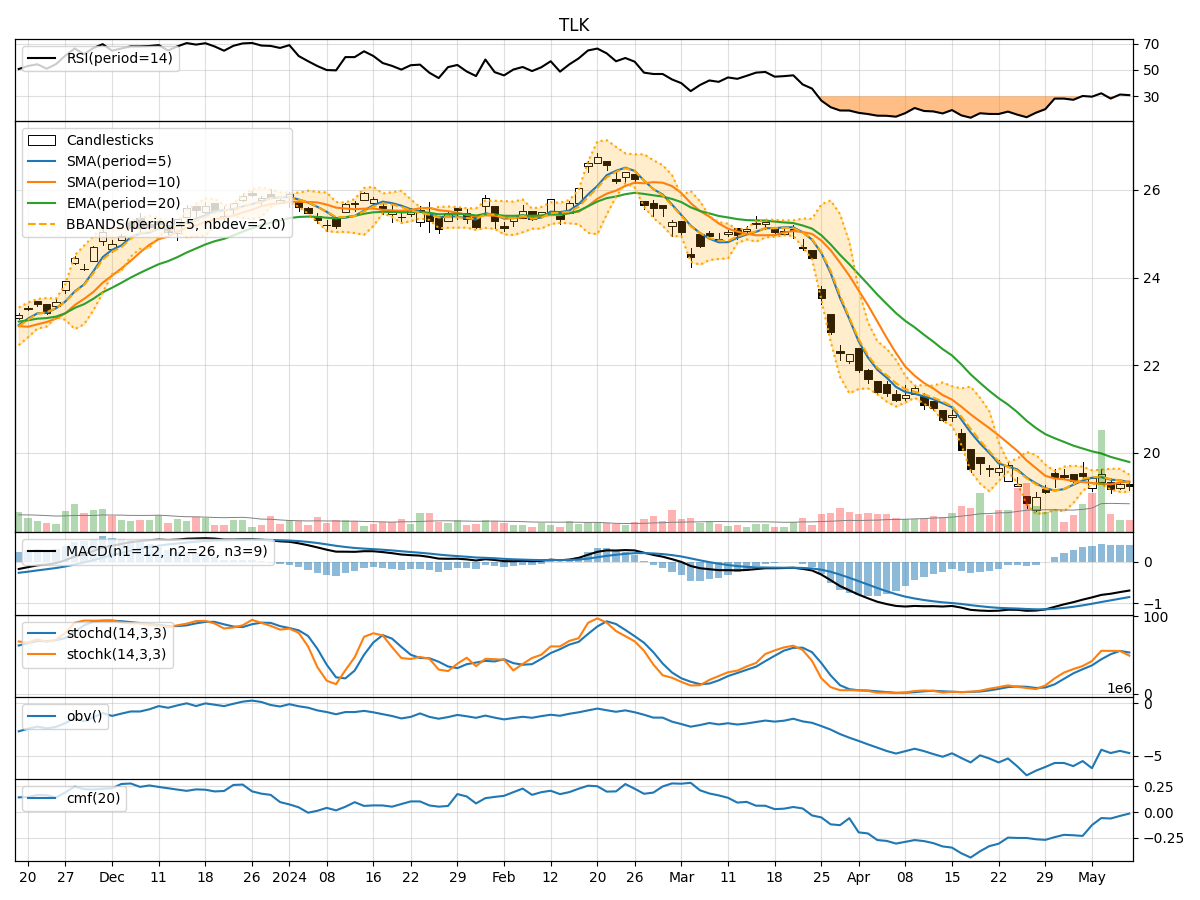
- Moving Averages (MA): The 5-day Moving Average (MA) has been fluctuating around the closing prices, indicating short-term price trends. The Simple Moving Average (SMA) and Exponential Moving Average (EMA) show a downward trend, suggesting a bearish sentiment.
- Moving Average Convergence Divergence (MACD): The MACD and Signal Line are negative, indicating a bearish trend in the stock price.
Momentum Analysis:
- Relative Strength Index (RSI): The RSI is below 50, indicating a bearish momentum in the stock.
- Stochastic Oscillator: Both %K and %D are showing a downward trend, suggesting a bearish momentum.
- Williams %R (WillR): The Williams %R is in the oversold territory, indicating a bearish sentiment.
Volatility Analysis:
- Bollinger Bands (BB): The stock price has been trading within the lower Bollinger Band, suggesting a potential oversold condition.
- Bollinger Band Width (BBW): The Bollinger Band Width is narrowing, indicating decreasing volatility in the stock price.
Volume Analysis:
- On-Balance Volume (OBV): The OBV has been declining, indicating selling pressure in the stock.
- Chaikin Money Flow (CMF): The CMF is negative, suggesting a bearish sentiment in the stock.
Key Observations and Opinions:
- Trend: The trend indicators point towards a bearish sentiment in the stock price.
- Momentum: The momentum indicators also support a bearish outlook with RSI below 50 and Stochastic Oscillator showing a downward trend.
- Volatility: The narrowing Bollinger Bands and decreasing volatility indicate a potential consolidation phase.
- Volume: The declining OBV and negative CMF signal selling pressure in the stock.
Conclusion:
Based on the analysis of the technical indicators, the next few days' possible stock price movement for TLK is likely to be bearish. The trend, momentum, and volume indicators all point towards a downward trajectory in the stock price. The decreasing volatility suggests a potential consolidation phase, but the overall sentiment remains bearish. Traders and investors should exercise caution and consider short-term selling strategies in anticipation of further downside movement in TLK's stock price.