Technical Analysis of TME 2024-05-03
Overview:
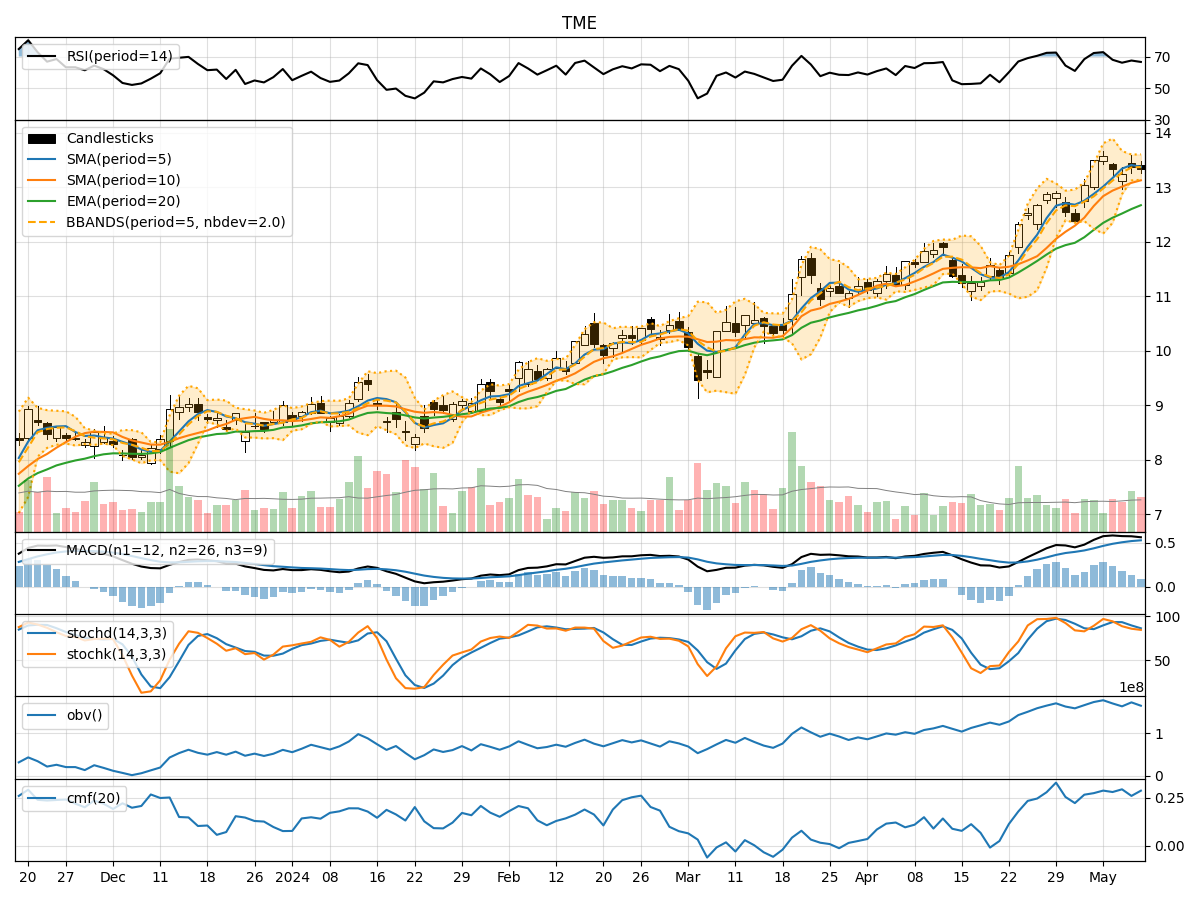
In analyzing the technical indicators for TME over the last 5 days, we will delve into the trend, momentum, volatility, and volume indicators to provide a comprehensive outlook on the possible stock price movement in the coming days.
Trend Analysis:
- Moving Averages (MA): The 5-day Moving Average (MA) has been fluctuating around the closing prices, indicating short-term price trends. The Simple Moving Average (SMA) and Exponential Moving Average (EMA) have been on an upward trajectory, suggesting a bullish trend.
- MACD: The Moving Average Convergence Divergence (MACD) has shown positive values, with the MACD line consistently above the signal line. This indicates bullish momentum in the stock price.
- Conclusion: The trend indicators suggest an upward trend in the stock price.
Momentum Analysis:
- RSI: The Relative Strength Index (RSI) has been in the overbought territory, indicating a strong bullish momentum in the stock.
- Stochastic Oscillator: Both %K and %D have been relatively high, suggesting strong buying pressure.
- Williams %R: The Williams %R has been fluctuating around oversold levels, indicating potential buying opportunities.
- Conclusion: The momentum indicators point towards a bullish sentiment in the stock.
Volatility Analysis:
- Bollinger Bands (BB): The Bollinger Bands have been widening, indicating increased volatility in the stock price.
- Conclusion: The volatility indicators suggest that the stock price may experience higher fluctuations in the coming days.
Volume Analysis:
- On-Balance Volume (OBV): The OBV has been increasing, indicating higher buying volume in the stock.
- Chaikin Money Flow (CMF): The CMF has been positive, suggesting that money is flowing into the stock.
- Conclusion: The volume indicators signal positive accumulation in the stock.
Conclusion:
Based on the analysis of the technical indicators, the overall outlook for TME stock is bullish. The trend indicators show an upward trajectory, supported by strong momentum and positive volume accumulation. However, the increasing volatility may lead to higher price fluctuations, so investors should be prepared for potential short-term swings. Considering the current market dynamics and technical signals, the next few days are likely to see an upward movement in TME stock price. Investors may consider capitalizing on buying opportunities during potential dips to ride the bullish trend.