Technical Analysis of TTE 2024-05-10
Overview:
In analyzing the technical indicators for TTE stock over the last 5 days, we will delve into the trend, momentum, volatility, and volume indicators to provide a comprehensive outlook on the possible stock price movement in the coming days. By examining these key indicators, we aim to offer valuable insights and predictions to guide investment decisions.
Trend Analysis:
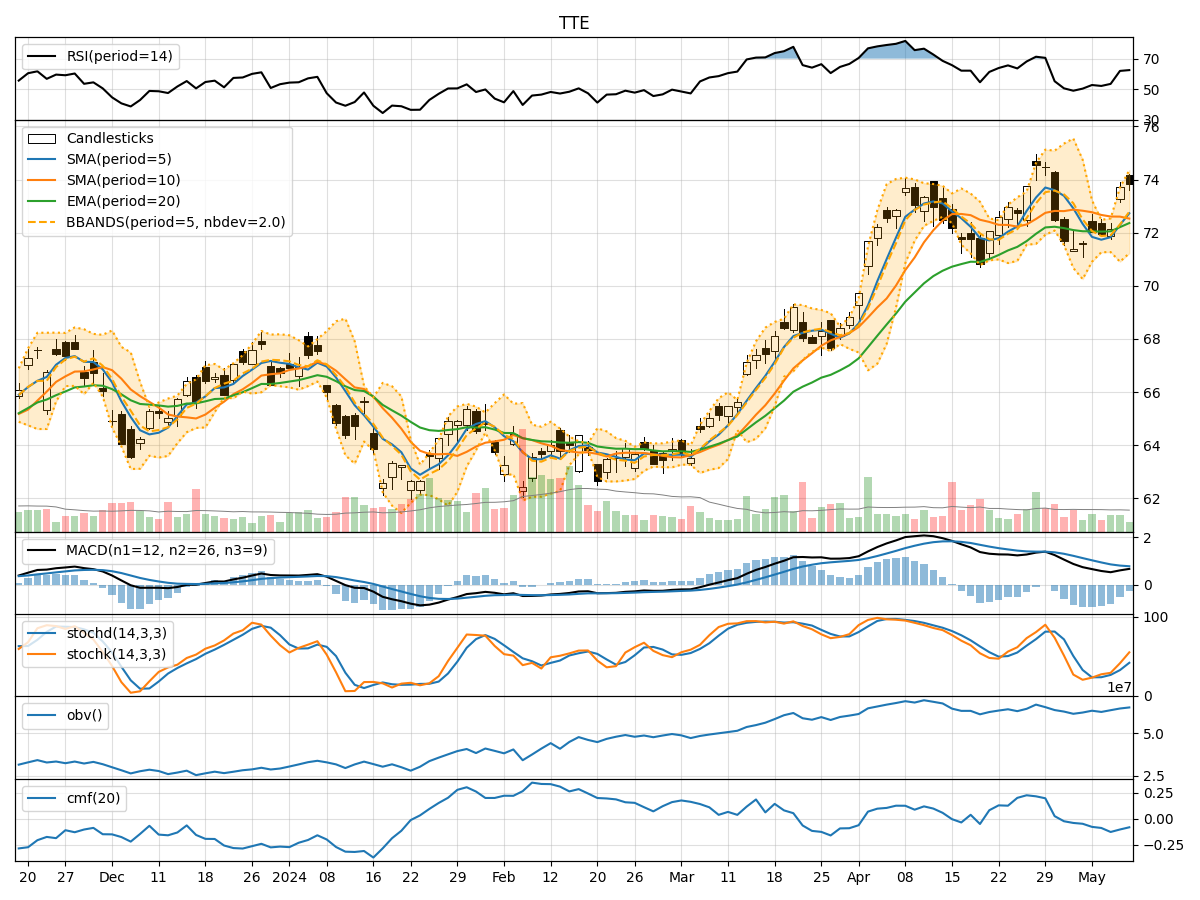
- Moving Averages (MA): The 5-day Moving Average (MA) has been fluctuating around the closing prices, indicating short-term price trends. The Simple Moving Average (SMA) and Exponential Moving Average (EMA) show a slight convergence, suggesting a potential trend reversal.
- MACD: The Moving Average Convergence Divergence (MACD) has been decreasing, with the MACD line moving below the signal line. This indicates a bearish momentum in the stock price.
- Conclusion: The trend indicators suggest a bearish outlook for TTE stock in the near term.
Momentum Analysis:
- RSI: The Relative Strength Index (RSI) has been oscillating around the neutral level of 50, indicating a lack of strong momentum in either direction.
- Stochastic Oscillator: Both %K and %D lines of the Stochastic Oscillator have been rising, reaching the overbought zone. This suggests a potential reversal in momentum.
- Conclusion: The momentum indicators signal a neutral to slightly bearish sentiment for TTE stock.
Volatility Analysis:
- Bollinger Bands (BB): The Bollinger Bands have been widening, indicating increased volatility in the stock price. The current price is hovering around the upper band, suggesting a potential overbought condition.
- Conclusion: The volatility indicators point towards increased volatility and a possible overbought scenario for TTE stock.
Volume Analysis:
- On-Balance Volume (OBV): The OBV has been fluctuating, indicating a balance between buying and selling pressure. The Chaikin Money Flow (CMF) is negative, suggesting a net outflow of money from the stock.
- Conclusion: The volume indicators reflect a neutral stance with a slight inclination towards selling pressure.
Overall Conclusion:
Based on the analysis of trend, momentum, volatility, and volume indicators, the overall outlook for TTE stock in the next few days is bearish. The trend indicators point towards a potential reversal, while momentum signals a lack of strong bullish momentum. Increased volatility and selling pressure indicated by volume indicators further support the bearish view.
Recommendation:
Considering the collective analysis of technical indicators, it is advisable to exercise caution when trading TTE stock in the coming days. Traders may consider short-term bearish strategies or wait for a clearer trend confirmation before making significant investment decisions. Monitoring key support and resistance levels along with market developments is crucial to navigating the potential downside risk.
Disclaimer:
This analysis is based solely on technical indicators and historical data, and it is essential to consider other fundamental factors and market dynamics before making investment decisions. Market conditions can change rapidly, impacting stock prices unpredictably. It is recommended to conduct thorough research and consult with financial advisors for personalized investment advice tailored to individual risk tolerance and financial goals.