Technical Analysis of UBER 2024-05-10
Overview:
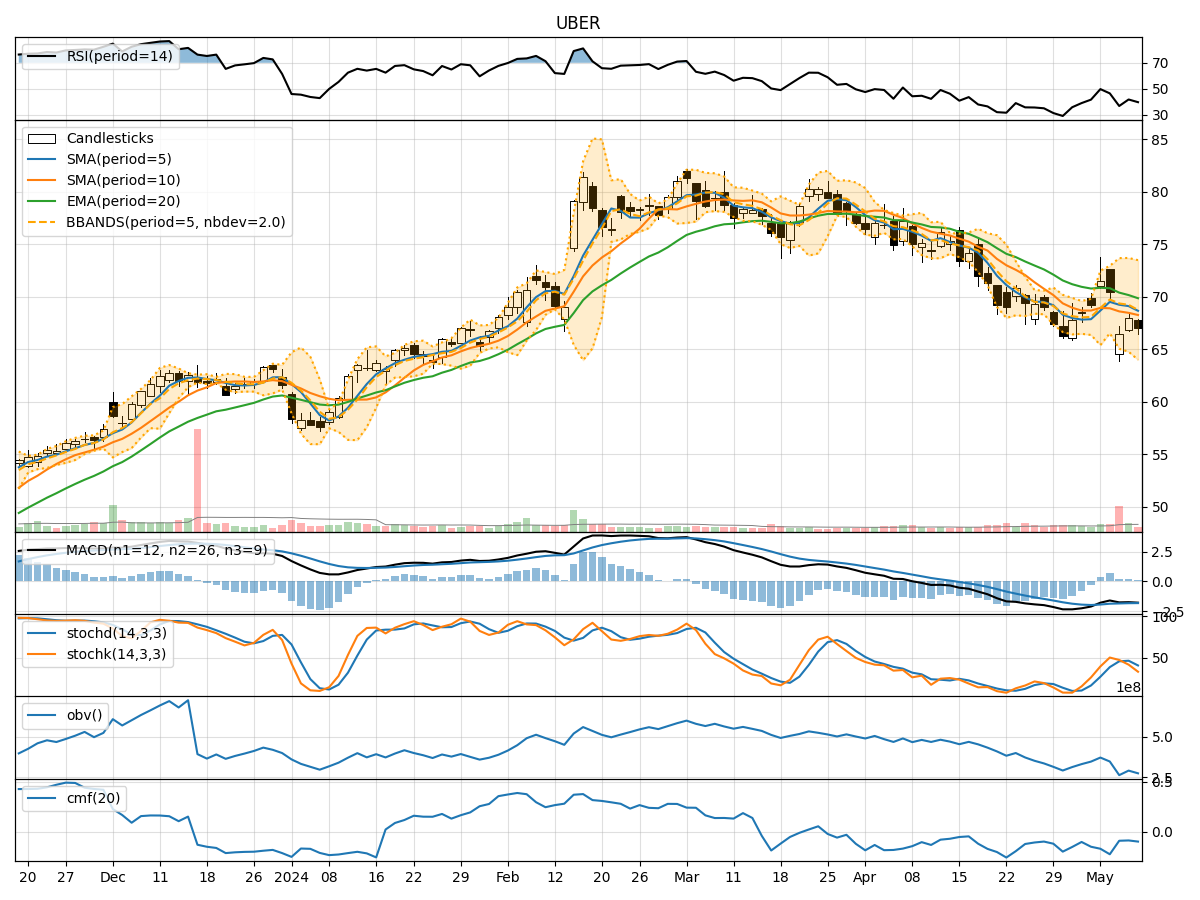
In analyzing the technical indicators for Uber (UBER) over the last 5 days, we will delve into the trend, momentum, volatility, and volume indicators to provide a comprehensive outlook on the possible stock price movement in the coming days.
Trend Analysis:
- Moving Averages (MA): The 5-day Moving Average (MA) has been below the Simple Moving Average (SMA) and Exponential Moving Average (EMA) consistently, indicating a bearish trend.
- MACD: The Moving Average Convergence Divergence (MACD) has been negative, with the MACD line below the signal line, suggesting a bearish momentum.
Momentum Analysis:
- RSI: The Relative Strength Index (RSI) has been below 50, indicating bearish momentum.
- Stochastic Oscillator: Both %K and %D have been below 50, signaling a bearish sentiment.
Volatility Analysis:
- Bollinger Bands (BB): The stock price has been consistently below the middle Bollinger Band (BBM), suggesting a bearish trend.
Volume Analysis:
- On-Balance Volume (OBV): The OBV has been consistently negative, indicating bearish volume flow.
- Chaikin Money Flow (CMF): The CMF has been negative, reflecting bearish money flow.
Key Observations:
- The trend, momentum, and volume indicators all point towards a bearish sentiment in the stock.
- The stock price has been consistently below key moving averages and Bollinger Bands, reinforcing the bearish outlook.
- The negative OBV and CMF further support the bearish volume flow in the stock.
Conclusion:
Based on the analysis of the technical indicators, the next few days are likely to see a continuation of the bearish trend in Uber's stock price. Investors should exercise caution and consider potential downside risks in their trading strategies. It is advisable to wait for a reversal in the technical indicators before considering any long positions.