Technical Analysis of USB 2024-05-31
Overview:
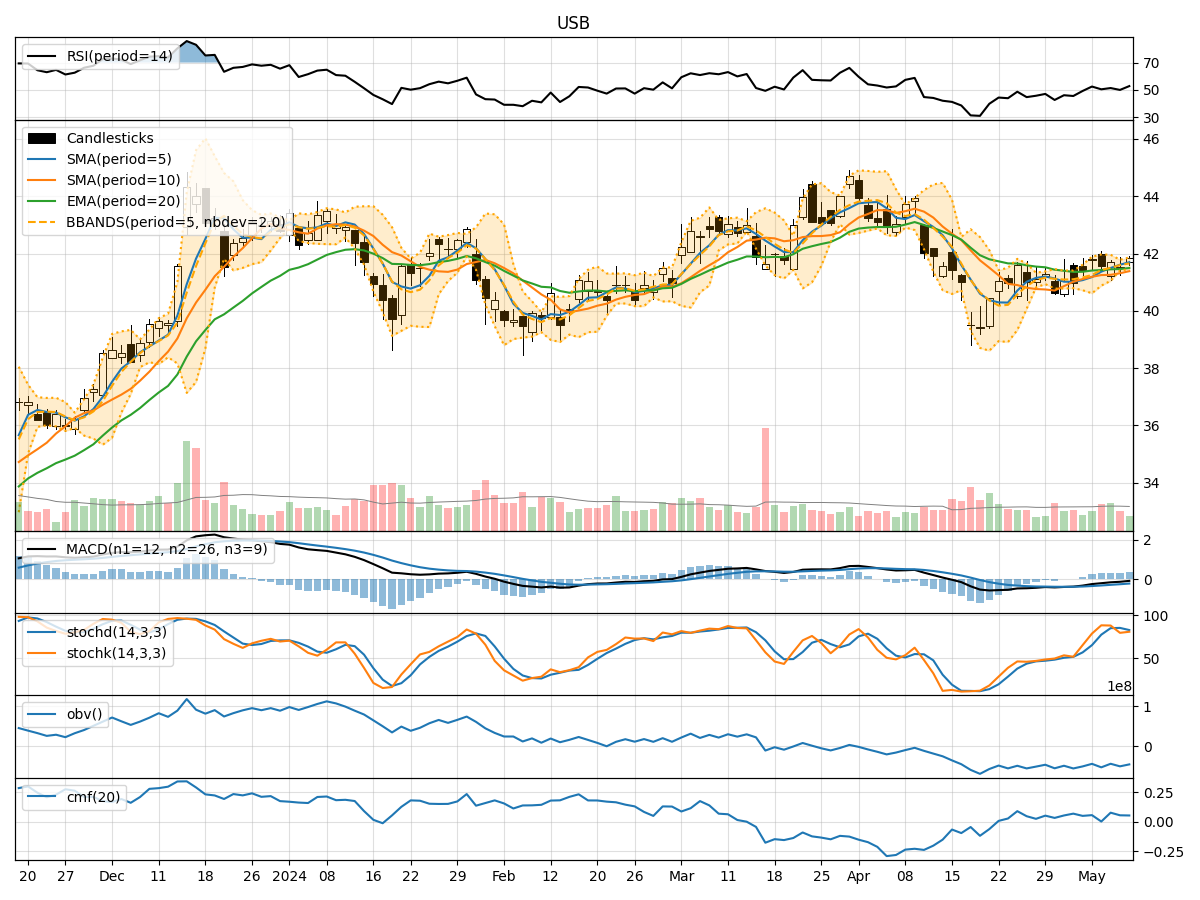
In analyzing the technical indicators for USB stock over the last 5 days, we will delve into the trend, momentum, volatility, and volume indicators to provide a comprehensive outlook on the possible stock price movement in the coming days. By examining these key aspects, we aim to offer valuable insights and recommendations for potential investors.
Trend Analysis:
- Moving Averages (MA): The 5-day MA has been consistently below the closing prices, indicating a short-term downtrend.
- MACD: The MACD line has been negative, with the MACD histogram showing a decreasing trend, suggesting a bearish momentum.
Momentum Analysis:
- RSI: The RSI values have been declining, indicating weakening momentum.
- Stochastic Oscillator: Both %K and %D values have been decreasing, signaling a potential oversold condition.
Volatility Analysis:
- Bollinger Bands (BB): The stock price has been trading below the middle Bollinger Band, indicating a lower volatility period.
Volume Analysis:
- On-Balance Volume (OBV): The OBV values have been negative, suggesting a higher selling pressure.
- Chaikin Money Flow (CMF): The CMF values have been consistently negative, indicating a lack of buying interest.
Key Observations:
- The trend indicators, momentum oscillators, and volume indicators all point towards a bearish sentiment in the short term.
- The volatility has been relatively low, indicating a lack of significant price movements.
- The selling pressure seems to be dominant based on the volume indicators.
Conclusion:
Based on the analysis of the technical indicators, the next few days for USB stock are likely to see further downward movement. The bearish trend, weakening momentum, low volatility, and negative volume indicators all align to suggest a continuation of the current downtrend. Investors should exercise caution and consider waiting for more favorable technical signals before considering any long positions.