Technical Analysis of VALE 2024-05-10
Overview:
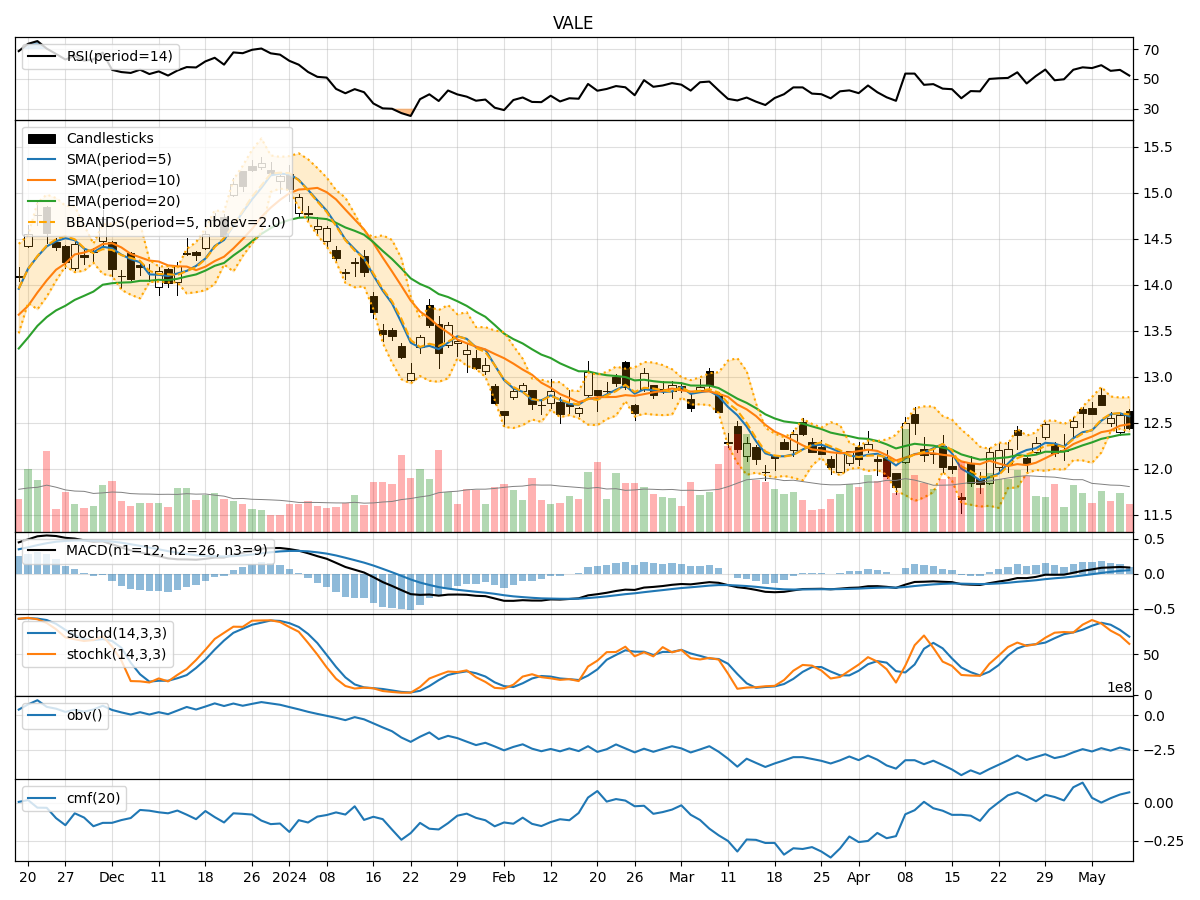
In analyzing the technical indicators for VALE over the last 5 days, we will delve into the trend, momentum, volatility, and volume indicators to provide a comprehensive outlook on the possible stock price movement in the coming days.
Trend Analysis:
- Moving Averages (MA): The 5-day Moving Average (MA) has been consistently above the Simple Moving Average (SMA) and Exponential Moving Average (EMA), indicating a bullish trend.
- MACD: The MACD line has been above the signal line, with both lines showing an upward trend, suggesting bullish momentum.
- RSI: The Relative Strength Index (RSI) has been fluctuating around the 50 level, indicating a neutral stance in terms of momentum.
Momentum Analysis:
- Stochastic Oscillator: The Stochastic Oscillator has been gradually decreasing but remains in the overbought territory, signaling a potential reversal or consolidation.
- Williams %R: The Williams %R indicator has been moving lower into oversold territory, indicating a bearish sentiment.
Volatility Analysis:
- Bollinger Bands (BB): The stock price has been trading within the Bollinger Bands, with the bands narrowing, suggesting a period of consolidation.
- Volatility Percentage (BBP): The BBP has been fluctuating around the midpoint, indicating a balanced volatility level.
Volume Analysis:
- On-Balance Volume (OBV): The OBV has shown mixed movements, reflecting indecision among market participants.
- Chaikin Money Flow (CMF): The CMF has been positive, indicating buying pressure in the market.
Key Observations:
- The trend indicators suggest a bullish bias, supported by the MACD and moving averages.
- Momentum indicators show conflicting signals, with the Stochastic Oscillator hinting at a potential reversal while the Williams %R indicates a bearish sentiment.
- Volatility indicators point towards a period of consolidation, as seen in the narrowing Bollinger Bands.
- Volume indicators reflect mixed sentiments, with OBV showing indecision but CMF indicating buying pressure.
Conclusion:
Based on the analysis of the technical indicators, the stock price of VALE is likely to experience sideways movement or consolidation in the coming days. The bullish trend indicated by moving averages and MACD may be offset by the conflicting signals from momentum indicators like Stochastic Oscillator and Williams %R. The narrowing Bollinger Bands suggest a period of consolidation, while volume indicators reflect mixed sentiments. Traders should exercise caution and closely monitor key support and resistance levels for potential breakout opportunities.